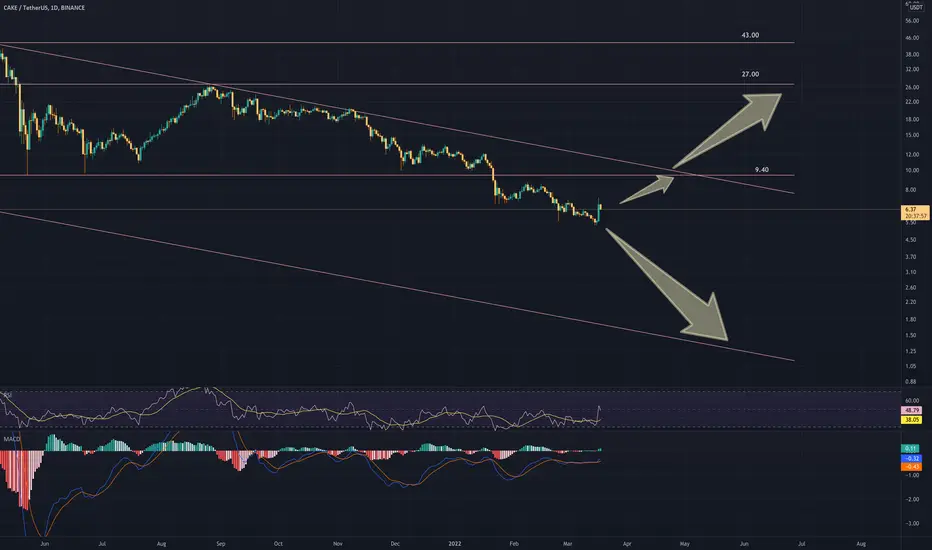
very Good time for cake is on the way just started...green candles are now breaking the downward trendline and time to accumulate cake ..this is not financial advice just educational post .
cake has also good news as well
CAKEUSDT trade ideas


CAKEUSDT - Daily Technical AnalysisSupport area 6.13
First area resistance: 10$
Second area resistance: 20$
Last area resistance: 44$~66$
below 6$ = fail idea

CAKE buy time ? 🤔🐺Hello traders 🐺 .
in this idea I want to talk about the pancake swap token (CAKE) , and in my opinion this is a very good buy opportunity for the CAKE holders , also if you looking for the staking the CAKE token , this could be a great opportunity for you , because currently CAKE is undervalue and if this coin trend reverse from bearish to the bullish , current price could be a very great buy opportunity .
Let's talk about the CAKE possible bottom :
in the chart above you can see in the overall view , CAKE was formed a very big M pattern or in the other word double top pattern , and after breaking the neck line which is also the weekly structure (red box) , price was dropped about 45% and reach the M pattern target which is shown by the 0.618 Fibonacci level .
in the other side we have a very clear descending channel which is currently CAKE is trading inside it and in my opinion you can make fantastic gain after break the channel .
RSI :
In the RSI we have a bullish divergence , which in my opinion could be the first sign of the trend reversal , and if price success to break the channel we could say that this is the confirmation of this bullish divergence .
TSI :
TSI is about to break above the zero line and if we put all of this information together , we can conclude that trend reversal is very imminent for the CAKE but always wait for the last confirmation and trade safely , but
how we can trade it ?
As you can see , CAKE is near to the daily resistance structure and the EMA Ribbon resistance lines , I expect something like a above picture for the CAKE and I like to wait for the break out from the daily resistance and also break above the EMA Ribbon and retest them as a new support for opening a long position on CAKE .
But always remember to trade based on your trading strategy and this idea is not a financial advice


CAKEUSDT Analysis(March 23)My expectation is the current price will make a breakout at Supply zone 6.77, If the price breakout is valid then the supply zone will become a swap zone/Demand zone.
Disclaimers:-
I AM NOT A FINANCIAL ADVISOR,EVERYTHING I SHARE IS JUST MY OPINION.

CAKEUSDT This route can be happenHello everyone
Cake is one of the most powerful token of defi exchange that can be have a campaign with Dydx in future
According to the chart and to the trend of market , you can see the market is moving to have some correction and need to recovery itself then its ready to continue the route as the trend wanna go .
This route that we can drwan on chart it can be the movement of the price to re-test again the support zone in the bottom (Blue box) and until the price is not broken the second key point level the trend is moving in downward and when this key point is broken the trend can be change to the upward.
If you wanna take position and buy or sell, check the chart with your own analysis and use your own strategy
Previous analysis :
Good Luck
Abtin

cakeusdt long positionPancake Swap has come to this day due to its stupid policies because this amount of tokens with this high profit of steak tanks has really increased the $ 40 currency to $ 6, but it seems that it is reforming its policy and reducing the profit of steak tanks. Has created the futures trading section inside an exchange office and it also burns tokens on a monthly basis. This can be a good entry point.

TRADE PLAN FOR CAKE Hello guys, a look at cake and its projections, the market current has positive sentimentals which is good for crypto. the growth on the usage of crypto is widen and across different countries also the s & p index . am expecting a breakout on cake towards the $ 8,43 area.
Tradehubng


CAKE FULL ANALYSIS...!Cake has taken back a very important level (green box). Therefore, good growth can be expected from it. Of course, market conditions must also be considered. Be very aware of the invalid level.

CAKE : Support,resistance & target (requested) Cake, everything is on the chart..
according to MACD then should move up to next resistance
in case BTC dump then the target is dynamic support of downtrend channel.
trade safe n fun
feel free to share ur ideas
CAKE is bullish$CAKE is experiencing the retracement after the explosive movement to the upside. Fibonacci 0.5 level stopped the connection and now bullish movement is expected to continue and reach the resistance level at 7,4$

CAKEUSDT - SETUPCAKEUSDT price given a strong breakout and now retesting that level. Bulls are active after a long time so we are expecting that they will try to build a good momentum towards the upside.

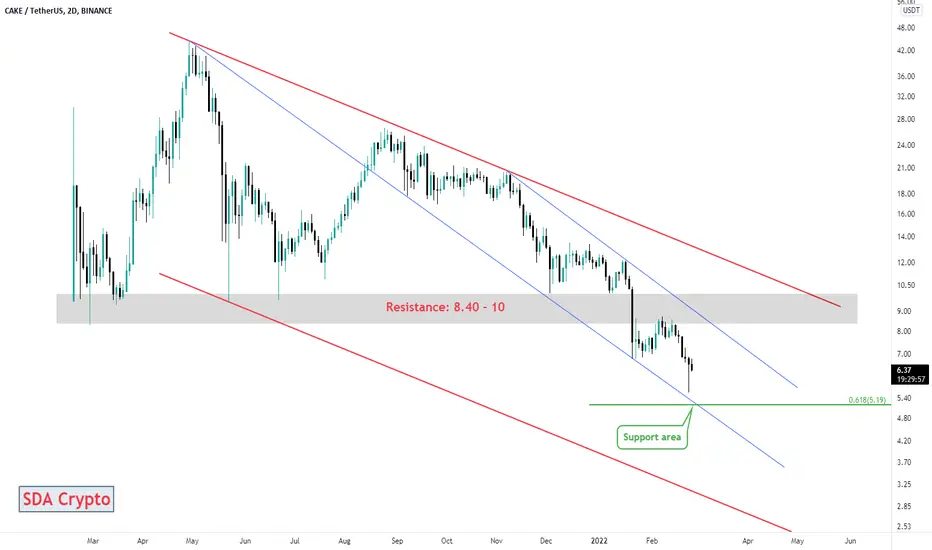
Pancake Swap (CAKEUSDT) TA: 22.2.27It has lost significant support and is declining in the downtrend channel. If the support is broken, $ 5 can fall to the bottom of the channel.
⚠️ This Analysis will be updated ...
👤 Sadegh Ahmadi: @SDQ_Crypto
📅 27.Feb.22
⚠️(DYOR)
❤️ If you apperciate my work , Please like and comment , It Keeps me motivated to do better
CAKEUSDT (PancakeSwap CAKE) 18-2-22 to 17-3-22 Midhigher RangeCake/usdt midhigher timeframe range, This range is fairly new and it formed a new bottom than backed up. as the range is new with a new bottom price can be pushed from these zones to a retrace point but that depends if market see's money coming into alts and peoples shows their to their ol cake. their are no logical profitable intraday setup showed up yet until march 16 2022. but this range did provided 2 swing positions.


cake looking goodcake looking good down here to accumulate
will be buying more if dip down more but atm its at a great price to buy

Cake break out will soon pump Near Pump DOnt Miss its very beatiful coin for just 2 months come on hurry up

CAKEUSDT (Long)CAKEUSDT bouncing off daily support level
Long
Entry at 5.95
Take Profit at 6.09
Stop loss at 5.85
Risk/reward ratio of 1:1.40

PancakeSwap CAKE Price Targets and Stop LossCAKE/USDT
Entry Range: $5.44 - 6.51
Price Target 1: $7.25
Price Target 2: $8.85
Price Target 3: $10.50
Stop Loss: $5.40

CAKE is bullish$CAKE is testing a strong support level. After the bounce off the level, bullish movement to the resistance level at 7$ is likely to happen.

CAKEUSDT-LONGBased on technical factors there is a long position in :
📊 CAKEUSDT PancakeSwap
🔵 Long Now 6.37
🧯 Stop loss 5.80
🏹 Target 1 6.75
🏹 Target 2 7.65
🏹 Target 3 9.20
💸Capital : 1%
We hope it is profitable for you ❤️
Please support our activity with your likes👍 and comments📝
