CAKEUSDT trade ideas

CAKE same PancakeThe cryptocurrency CAKE has high potential to reach its previous peak during the altcoin season.

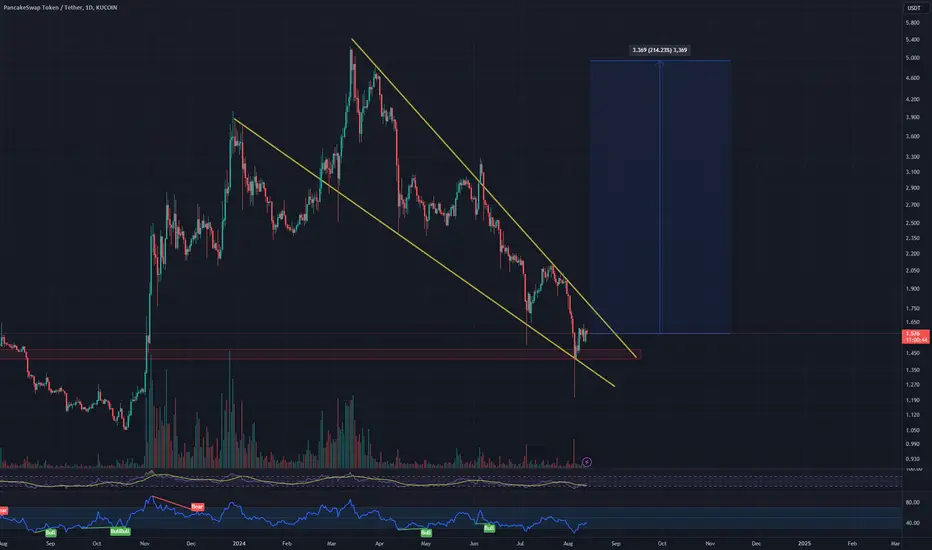
CAKE Secondary trend. Potential for this alt season #2. 11 2024Logarithm.
The main trend, published more than 1.5 years ago.
CAKE Basic trend. Working with reversal zones. Money management . 6 08 2023
The level zones are identical as before and now, nothing can change.
The main trend now without “market noise” and the average price of this cycle distribution.
Secondary trend. The price has left the descending channel and has gone sideways. The price is drawing a large double bottom. The first local target is its resistance. Then a big pump. Exit the position before everyone else before the key resistance levels.
Local trend . There is an exit with accumulation by impulse +50%. Now the prices are near the minimum of the trend in comparison with the huge pumping potential.

Pancake Swap (CAKE): Possible Fill of Inbalance Zones / Wait MSBPancake Swap coin has a good upward movement since last time we analysed the coin, and now we are expecting to see some kind of smaller correction to fill the FVG zone in combination with the CME gap!
More in-depth info is in the video—enjoy!
Swallow Team

CAKEUSDT - Imminent RetracementWave Structure Update: Intermediate Wave 3
The price has clearly completed a 5-wave cycle within the 3rd wave of intermediate degree. Following Elliott Wave guidelines, the next movement is expected to retrace toward the 4th wave of a lesser degree. This aligns with typical wave behavior, as corrections often seek the support zone of the prior lesser-degree 4th wave.
Additionally, a divergence between the 3rd and 5th waves of intermediate wave 3 adds further evidence of a potential reversal or consolidation phase before the next impulsive move. This divergence often signals waning momentum, supporting the case for an upcoming corrective wave.

Alikze »» CAKE | Bullish Wave 3 or C Scenario - 1W🔍 Technical analysis: Bullish Wave 3 or C Scenario - 1W
📣 BINANCE:CAKEUSDT In the long-term analysis mentioned earlier, after a zigzag correction to the $1 area, a reversal pattern (inverted head and shoulders pattern) has formed.
🟢 In accordance with the previous analysis , the target was touched.
🟢 But currently, on the weekly time frame, in continuation of the previous analysis, it is in the supply range.
🟢 Two possible behavioral scenarios can continue.
💎 First scenario: This upward movement can extend to the previous minor ceiling and, after a correction to the broken supply range, continue to the next supply area.
💎 Second scenario: If the current supply area cannot be broken (the current supply area is not used up), it can continue the upward path by breaking the supply area of the current range to the $5 area with a pullback to the broken swing.
⚠️ In addition, in both possible bullish scenarios predicted, the price should not enter the LVL validation range. If a price correction occurs and the price touches the aforementioned area, the bullish scenario is invalidated and should be re-examined and updated. ⚠️
»»»«««»»»«««»»»«««
Please support this idea 💡 with a LIKE 👍 and COMMENT 💬 if you find it useful and Click "Follow" on our profile if you'd like these trade ideas delivered straight to your email 📧 in the future.
Thanks for your continued support.🙏
Best Regards,❤️
Alikze.
»»»«««»»»«««»»»«««

#CAKE Reaches A Critical Moment—Will the Bulls Save the Day?Yello, Paradisers! Is #CAKE on the verge of a powerful bullish breakout, or will the bears crush any hopes of recovery? Let’s break down the latest analysis of #PancakeSwap:
💎After 5-6 months of a slow and steady downtrend, #CAKEUSDT is now reaching a crucial juncture. The price is testing the upper boundary of the descending channel, setting up for a retest that could ignite a major rally. But the bulls face a tough challenge: to trigger this breakout, #PancakeSwap must overcome the $2.00 resistance.
💎This level, once a solid support, has now flipped into a significant barrier. To confirm bullish momentum, the breakout must be backed by rising trading volume and a favorable interaction with the 20 EMA. If these conditions are met, a surge toward the next major resistance area becomes a real possibility.
💎However, there’s a serious risk if bulls lose steam. A failure to sustain momentum could lead to a pullback into the $1.46-$1.61 support zone, which has to hold to prevent deeper damage. If this area breaks down, we could see a swift move toward $1.20.
💎If $1.20 doesn’t hold, the bears could seize control, leading to a sharp correction and dashing hopes for a short-term bullish recovery.
The market can be brutal, and only those who approach it strategically will succeed.
MyCryptoParadise
iFeel the success🌴

Alikze »»CAKE | Reverse head and shoulders pattern🔍 Technical analysis: Reverse head and shoulders pattern
- In the previous analysis , it was mentioned that a head and shoulders pattern was formed, that the last correction log can extend to the range of 1.17.
- As mentioned, it is moving in a descending channel.
- Demand was met at the bottom of the descending channel and the range, which experienced a growth up to the top of the channel and the broken zone.
- Currently, in weekly and daily time, in addition to the descending channel, it is in a concentration.
- In addition, it is suspected that the head and shoulder pattern is the opposite. Therefore, I expect it to advance to the supply zone after the last bearish leg and the right shoulder are completed, out of congestion.
💎 Note: It is necessary to explain that the right shoulder should not be extended to the previous area, in which case the alternative scenario should be checked and the post updated.
»»»«««»»»«««»»»«««
Please support this idea with a LIKE and COMMENT if you find it useful and Click "Follow" on our profile if you'd like these trade ideas delivered straight to your email in the future.
Thanks for your continued support.
Best Regards,❤️
Alikze.
»»»«««»»»«««»»»«««
BINANCE:CAKEUSDT

Destiny CAKEThe cycle I expect from this cryptocurrency reminds me of the past of BNB, it is definitely one of my priorities for purchase, but at the price of $1.9.

SasanSeifi| Price to Test $2.50!Hey there, ✌ As observed in the daily timeframe BINANCE:CAKEUSDT , the price has been moving back and forth within the price range of $1.50 to $2.00 for some time. Currently, after the price has once again tested the demand zone around $1.50, we have witnessed a positive reaction and increased demand, which has driven the price upwards. Additionally, the downward trendline has been broken.
Given the current market conditions and the overall analysis indicating an increasing market bias towards a bullish trend, it’s likely that we will see significant price growth in the mid-term. In this scenario, if the price can maintain the levels between $1.70 and $1.80, we will likely continue to see upward movement, with the price targeting the next supply zone between $2.10 and $2.20.
In this range, we may see a negative reaction, which could lead to a consolidation phase or minor correction. However, after a potential pullback, the bullish trend is expected to resume, with the price targeting higher levels at $2.50, and eventually reaching longer-term targets around $2.80 or even $3.00. To better understand the continuation of the trend, it will be important to see how the price reacts to the mid-term target at $2.50.
💢 Please remember that this is just my personal viewpoint and should not be taken as investment advice. I’d love to hear your thoughts and share opinions!
Happy trading!✌😎
Sure, if you have any more questions or need further clarification, feel free to ask. I'm here to help!✌

Cake superbThat Fbuy print on cake clearly breaking structure was icing on cake. If more volume inflows happen then we can see 4 dollar for sure
DYOR
For indicator access message me

Long, target 2.8, 25% gainFollowing weekly chart.
I got a long signal from my 3 power indicators. I did a lot profit from the same setup today with sushiusdt, please check it out.
It can go far long but my target is 2.8.
I'd stop below 1.69 candle close.

The analysis for $CAKE/USDT#CAKE/USDT
The analysis for $CAKE/USDT suggests a bullish breakout opportunity as the price attempts to exit a descending wedge pattern, a structure that typically signals a reversal. After consolidating near the support zone at $1.808, the price is showing signs of recovery, with significant upside potential.
Key Targets:
$3.317
$4.710
$6.128


CAKEUSDT.1DCAKE/USDT daily chart, several critical levels and technical signals stand out. The price is currently trading at around 1.907, and I've identified key resistance and support zones that could shape the near-term price action. Resistance levels are observed at R1 (2.104) and R2 (2.440), while the support levels are located at S1 (1.494) and S2 (1.200). These levels create a framework for potential movement, indicating areas where price reversals or continuations may occur.
The chart shows a descending triangle pattern forming, which often signals bearish continuation but can also act as a consolidation phase before an upward breakout. Currently, CAKE is testing the upper boundary of this triangle near S1. A successful breakout above the descending trendline and R1 could suggest a bullish shift, with a possible target at R2 if momentum strengthens. Conversely, a rejection at this resistance could push the price back toward S1, and if breached, the price might slide further toward S2.
The MACD (12, 26) indicator is slightly positive, with the MACD line crossing above the signal line, indicating a potential shift towards bullish momentum. This crossover suggests that buyers are gaining strength, which could support a breakout scenario if buying pressure persists. However, I’ll monitor the MACD histogram closely, as any decrease in its positive momentum could signal weakening bullish interest.
In conclusion, my outlook for CAKE/USDT is cautiously optimistic. The next few sessions are critical, as a confirmed breakout above R1 would likely set a bullish tone, targeting R2 at 2.440. However, if the price fails to hold above S1, I would anticipate a retest of lower support at S2, around 1.200. I remain observant, ready to adjust my perspective based on the market's reaction at these crucial levels.

cakecake technical analysis basically on elliott waves Principles
cake can be make a high on 19$
wait and watch

#CAKE PancakeSwap Poised for a Sweet Rebound?This chart displays PancakeSwap #CAKE against Tether #USDT on a daily timeframe. CAKE has been trading within a descending channel, but recent price action indicates a potential breakout, suggesting a shift in momentum. The current price stands at $1.572, up by 3.15%, and the projected target is $5.293, implying a significant 234.01% upside. This technical setup hints at a possible major move upward, making it an enticing opportunity for those looking to ride the next wave in the market.
⚠️ All trading ideas are published with a time delay. If you want to follow the trading in real-time, please follow the link:
Cakeusdtsemi forgotten high quality project living mostly on bsc but is now multichain and very highly regarded aka it won't crash or binance's reputation will be 0
73% to the bear market highs post probable unlock event and dilution from farming, probably the new range unless some massive burns take place..
still quite a high % gain on offer..
cz outta jail
crypto market heating up
alts will run after btc breaks aths..
might not be till november or next year but still it looks inevitable

Signal for CAKESignal for CAKE/USDT 🎯
Entry Point (Buy):
📉 1.912 - 1.930
This is the suggested buy range based on support and the ascending channel.
Take Profit Targets (TP):
🎯 TP-1: 1.929
🎯 TP-2: 1.952
🎯 TP-3: 1.974
🎯 TP-4: 2.000
Stop Loss (SL):
❌ 1.895
If the price breaks below this level, it's recommended to close the position.
🚀 Summary:
The price is in an uptrend inside an ascending channel, and entry at the current support levels could lead to potential profit if the targets are hit. If the support fails, the stop loss will limit the downside risk.

CAKE it's time to bullish?CAKE has shown strength in latest trend, its shown shift of structure, deal in range, and possible getting into erl liquidity, while i always take partial from liq to liq its clearly a matter of taste of your own. Is it time to chip in?


DreamAnalysis | CAKEUSDT Start Uptrend?👋 Welcome back to your favorite channel, D reamAnalysis! Today, we're going to analyze one of the key utility coins in the crypto space, PancakeSwap (CAKE), and explore its future potential.
🌐 What is PancakeSwap (CAKE)? PancakeSwap is a decentralized exchange (DEX) built on Binance Smart Chain (BSC). It allows users to swap BEP-20 tokens using the Automated Market Maker (AMM) model. Users can stake tokens to provide liquidity and earn CAKE tokens as rewards.
📊 Weekly Time Frame Analysis:
After being rejected at the top of the weekly box resistance at 4.789, CAKE moved towards the bottom, but this time, it didn’t reach the previous l ow. This indicates strong buyer momentum and a lack of sellers in the market.
Currently, CAKE is stuck below the resistance at 2.077. If it breaks this resistance with strong volume and RSI confirmation, we can consider a buy position for spot and long-term holding, with a stop loss placed at the bottom of the box around 1.089.
💡 Recommendation: Before investing, I suggest researching the project further to understand if you can maximize your profit. The main trigger for the uptrend will be breaking 4.789, which will mark the start of a solid upward movement.
📅 Daily Time Frame Analysis:
For the third time, CAKE is testing the resistance at 2.055. This time, there’s a higher chance of breaking through because we’ve registered higher lows since 1.41, indicating a stronger upward trend.
Additionally, during this move towards resistance, volume has increased, and the RSI is rising above 70, which is another confirmation that we may break through the resistance. 🔗 Chart Analysis
⏳ 4-Hour Time Frame Analysis :
In this time frame, CAKE has moved up with the help of a parabolic trend, creating higher highs and higher lows. However, the size and number of candles are decreasing, showing signs of trend weakness. But remember, trend weakness alone doesn’t confirm a reversal.
📈 Long Position:
Our entry trigger is clearly set, and upon breaking 2.084, we can open a long position and aim for higher targets.
📉 Short Position:
This largely depends on Bitcoin’s movement. For a short position, we need a trend reversal or a break below the parabolic line and the support at 2.006.
💬 This wraps up today’s analysis. If you found this helpful, feel free to share it with your friends and leave a comment with your thoughts or any other pairs or coins you’d like us to analyze.
📌 These analyses are merely our ideas based on a chart that doesn’t follow strict rules. Technical analysis is an art, and these insights are not financial advice.

bullish 4h cake usdtcake usdt bullish fibo
that's my idea
if you have any question please let me know
