Mizuho Financial Group, Inc. | Chart & Forecast SummaryKey Indicators On Trade Set Up In General
1. Push Set Up
2. Range Set up
3. Break & Retest Set Up
Notes On Session
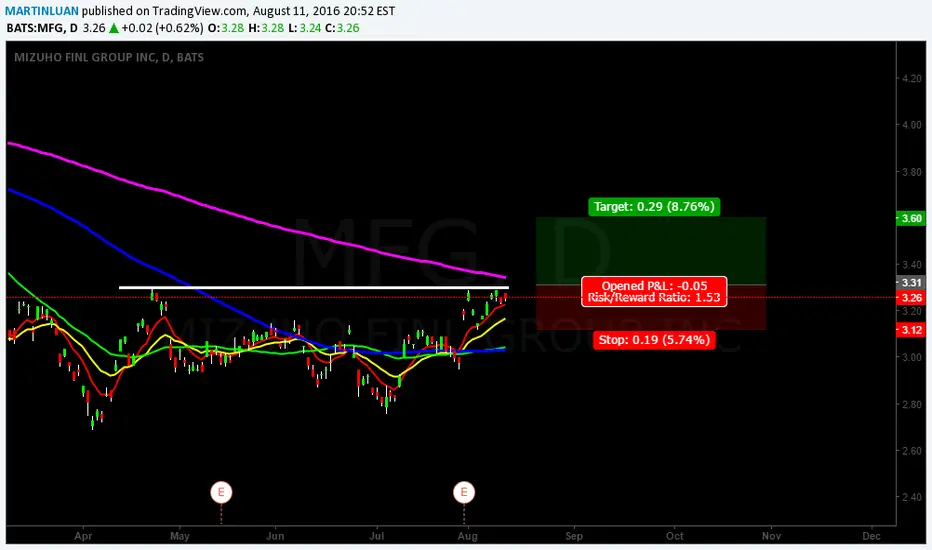
# Mizuho Financial Group, Inc.
- Double Formation
* 012345 | Wave Count Survey Completed | Subdivision 1
* (Neckline) At 3.200.00 JPY
- Triple Formation
* (Flag Structure) | Uptrend Bias Entry Condition | Subdivision 2
* Retracement Numbered | Subdivision 3
* Daily Time Frame | Entry Settings Configuration
Active Sessions On Relevant Range & Elemented Probabilities;
European Session(Upwards) - US-Session(Downwards) - Asian Session(Ranging)
Conclusion | Trade Plan Execution & Risk Management On Demand;
Overall Consensus | Buy
8411 trade ideas

8411 on TSEThe market is on uptrend so buying is good. The demand level has a good structure and profit margin.

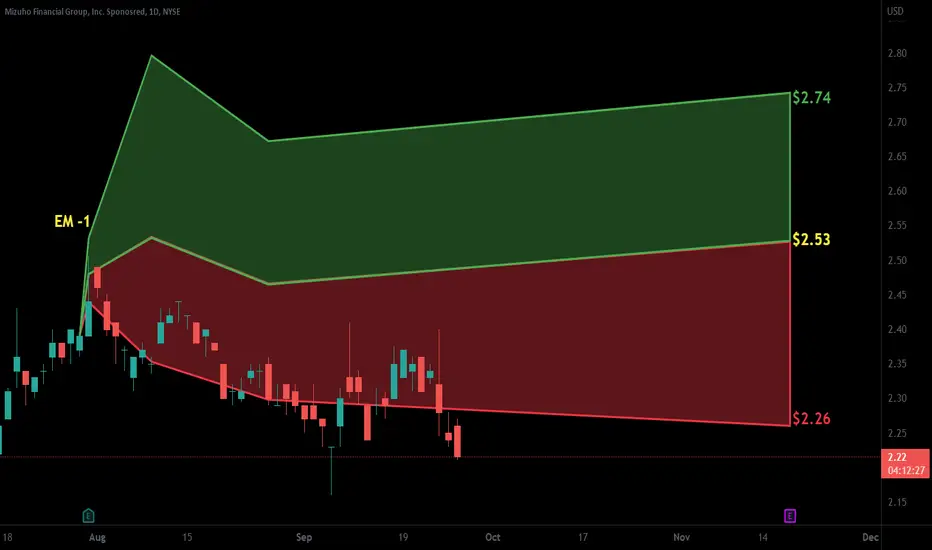
8411 (Mizuho Financial Group) - Strong Upside Follow-Through8411 (Mizuho Financial Group) - Strong Upside Follow-Through
The green shaded area represents the post-idea price development.
The original idea is attached.

8411 (Mizuho Financial Group)Mizuho Financial Group, Inc., abbreviated as MHFG, or simply called Mizuho, is a banking holding company headquartered in the Ōtemachi district of Chiyoda, Tokyo, Japan. The name "mizuho" literally means "abundant rice" in Japanese and "harvest" in the figurative sense.
Potential Swing Buy/Long.

$MFG with a neutral outlook following its earnings #Stocks The PEAD projected a Neutral outlook for $MFG after a positive over reaction following its earnings release placing the stock in drift B with an expected accuracy of 70%.

MFG: Long term strategyThis chart indicates a strong relation of MFG (generally applies to most bank stocks) with gov yield rates - 5 year Japanese bond in this case.
Considering the chart pattern, there is still a possibility of testing a bottom for a couple of months, but the stock price should soon catch up with the yield rate.
As the downside risk is limited, we may be seeing a great opportunity to accumulate and add these stocks to your portfolio for income gain.
FRB started rasing the funds rate. This may continue for a couple of years and it is best to watch their monetary policy.
The current inflation we are experiencing is worldwide and BOJ will follow FRB - FRB is running ahead of BOJ.
FRB will tell you when to exit.

$MFG with a Bullish outlook following its earnings #Stocks The PEAD projected a Bullish outlook for $MFG after a Positive Under reaction following its earnings release placing the stock in drift A with an expected accuracy of 75%.

$MFG with a Bullish outlook following its earnings #Stocks The PEAD projected a Bullish outlook for $MFG after a Positive Under reaction following its earnings release placing the stock in drift A.
$MFG with a Neutral outlook following its earnings #Stocks The PEAD projected a Neutral outlook for $MFG after a Positive Under reaction following its earnings release placing the stock in drift B with an expected accuracy of 66.67%.


Another No-brainer buy*** THIS IS NOT AN ADVICE, DO YOUR RESEARCH AND TRADE WITH YOUR OWN RESPONSIBILITY***
Symmetrical Triangle formed right on that channel lower trend line.
NIKKEI is getting bullish, USDJPY going up as well.
The rising sun is back in business.


MGB LONGMuy probablemente al llegar al precio de 3.31 logre hacer un alza important hacia high price, lo que puede dar an excelent profit