Possible short for AGL coming soon.Following a stochastic, MACD and EMA momentum strategy, AGL is showing two of the three confirmations for a short, if it trades lower today and the EMA's cross, I will take this as confirmation to enter a short position.
AALL trade ideas


AGL vs BHP Anglo American Plc vs BHP Group | AGL has broken out to an eight-year high versus BHP with an advance from a rounding formation.
Key Points:
(1) Previous under-performance was 9 years.
(2) Current out-performance is 5 years
(3) RSI Strong (62.96) but not overbought
(4) MACD remains in bull regime, with recent 'fresh' bull cross above the centre line.
*This chart forms part of a larger client note.

AGL - Double TopA double top has formed on JSE:AGL . I'll keep an eye on this for one for a break below 43000. If it confirms, we could be looking at a downward move for a short position.

AGL - Long if we see a triangle breakoutJSE:AGL has formed a flat-top triangle and it is looking like we might see a bullish breakout soon. If it breaks through the top of the triangle, I will consider going long with a target around the previous highs of mid-August.


$JSEAGL - Testing TL supportAnglo's currently testing major TL support. Possible good entry for a long, but use tight stop loss if support is breached. Alternate play is a short position should support not hold.

Low...Lower...AngloBig break today below both the parallel support-line & the 50-day Exponential Moving Average (EMA). Should this not be a false break, could see us test the R400 levels soon, with a break and close below R400 most probably testing the R387.50 levels. Strong support only at the 200-day EMA at R377.50.
Would stay clear of any short-term long positions until we move back into the channel.
Thomson Reuters consensus target price on Anglo's is still R445.10 & am I still extremely positive on the long-term prospects of the group. Would therefore use any weakness as a buying opportunity. Will keep you posted...


AGL - Short Term ScenarioAnglo American Plc | With all prospective opportunities, we always want to remain open-minded to potential moves. More importantly, we want to be prepared to take action based on potential setups. A review of the short term (daily) chart for AGL sees the price in an upward trend but encountering selective selling at the R415 to R418 level. This consolidation zone (Box #2) appears quite similar to the prior consolidation period (Box #1) where we saw a brief breakout of the consolidation range followed by a reversal candle and subsequently trend lower. Could this again be the case over the next few trading sessions for the share where a 'pop' above R420 is follow by a 'fade'? Alternatively, the 50-day EMA (currently at ~R387.00-R389.00) may provide an opportunity on the buy/long side.

Inverted Head & Shoulders BreakoutJSE:AGL has broken through the neckline of an inverted Head & Shoulders pattern and if it plays out, we could be looking at a nice target around the 60 000 level. I will proceed with caution, however, as the neckline is at a very strong level of resistance and may struggle to convincingly break through.

AGL v AMSAnglo American vs Anglo Platinum | Relative Chart has seen price clear the 8 and 21 EMA with subsequent clearance of the 50-EMA. Prior to this we saw the recent downward trend line being breached. R1 and R2 being targeted as the trend turns from neutral to bullish. Please also bear in mind we could see a pull back (re-test) from the break before the ‘official’ trend change comes into play.
This chart forms part of a larger research note and should not be considered financial advice.

Anglo American PLC (AAL - LSE) 4th wave triangle Anglo American PLC (AAL - LSE) is moving down in impulse wave, where 4th wave is a triangle. After broken down, it will go to new low as 5th down of impulse sequence started from major top on chart.

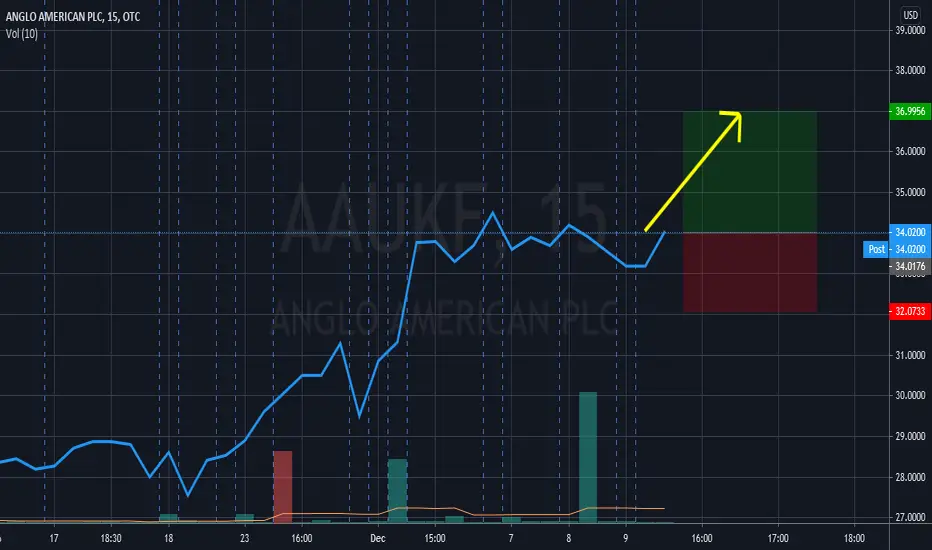
Anglo American PLCI expect to see upside from here on forward in the market.
Spesifically to anglo the average down turn in 2007-09 we saw 54% losses followed by gradual upside after that. Based on that being one of the worst downsides if not the worst as a major support in the equities market and the luming fact that we might see a COVID 19 cure this year only spells upside. With Economies opening up and lockdowns in South Africa loosening all of this spells positive results for Anglo, this is Anglo PLC, Platinum and Gold.
Anglo PLC I have opened positions in the range of:
32500-33100 BUY
I believe Anglo has show the right methodollogy in the current market and will endure and grow, financials aren't the correct staff of measurement although it plays a roll, the true measurement staff would be where is the plans leading that a company is implementing.
I expect Anglo to be back to the 40000 - 45000 range within the following 3-6 months major upside for day traders and shareholders (newly purchased shares).

Weekly game plan 5 April 2020 - AGLPotential bearish break from that previous support/resistance zone could trigger a short.

AGL - Bearish ContinuationWe may derive the following from the AGL Weekly chart:
1. Given the current bearish trend in AGL, it is probable that it will continue.
2. Price appears to have hit the previous support (now resistance) and turned to the downside.
3. Check the lower time frames for possible entries.
4. As always - maintain your risk.
Note: The views provided herein do not constitute financial advice.

Weekly game plan 15 March 2020 - AGLLooking for history to repeat itself? A move down to that target area would complete a similar pattern when compared to 2008 financial crisis. Is this going to work out the same?


AGLAnglo American Plc
Buy if it trades at 33300c-33500c. SL: 32700c
Sell if it backtests 38500c. SL: 39200c

