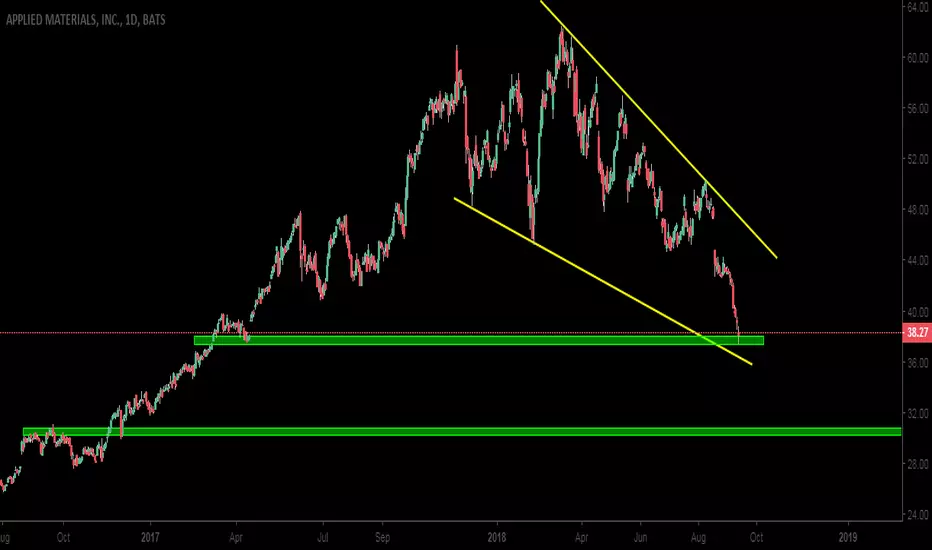
AMAT - Negative OutlookAMAT looks poised to remain in decline after failing to break resistance at DTL
AMAT trade ideas


AMAT LongLong based of channels and fibs
My Entry: .00 (any entry above this is fine)
Stop Loss: 1650.00
PT: 1440.00 area
Risk/Reward: 1:3.4

AMAT Head & Shoulders Formation w/TargetNot much to see here; Plain and simple trading with a minimum expected movement from a Head & Shoulders.
Lots of negative news coming out about this company, but it isn't moving the price as much as it used to.
With the general market being bearish on tech, and lot of bad news coming out that isn't moving prices, this could is a good long opportunity w/confirmation of price movement.
Will be taking a short term $40 call option upon break of the $36 level, cutting losses if it goes below $35 again. Super short term.

AMAT breaks above 50DMAImportant close today for AMAT if it can hold above that 50DMA; next target would be $38

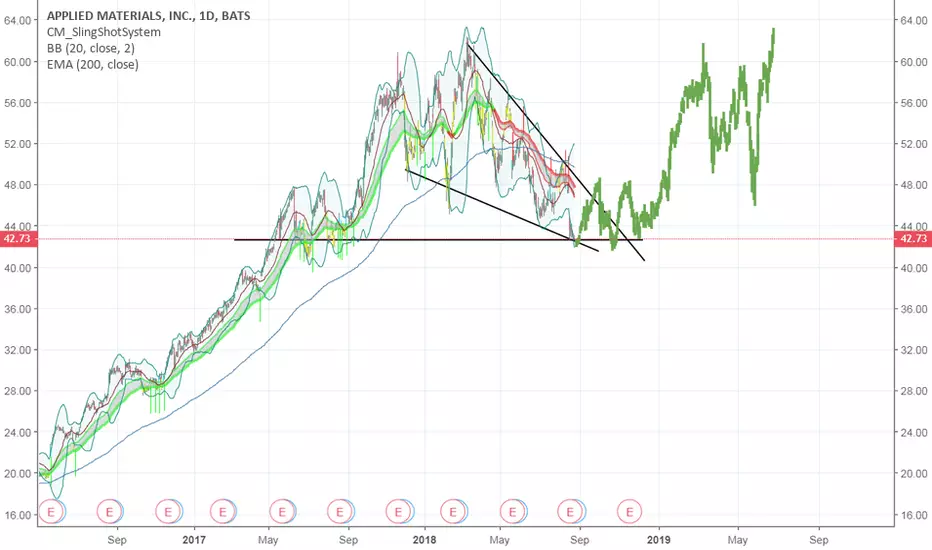
$AMAT Bear Flag$AMAT forming a possible bear flag on the daily with a rising wedge into 50d ema resistance. Expecting $36 resistance to hold this week. Two possible medium term targets on chart.
Note: Information analysis, not investment advice.


AMAT SpeculationAfter using Multi - Time frame analysis, I have determined the Bigger picture trend is bullish. On the correction we will look for an entry here.

Applied Materials, Inc (AMAT) long.Targets and stops on the chart.
Don't forget to like and follow.
Thank you.

AMAT may stage a minor reboundWith positive divergence seen on its MACD and RSI, the stock may see a bounce next.

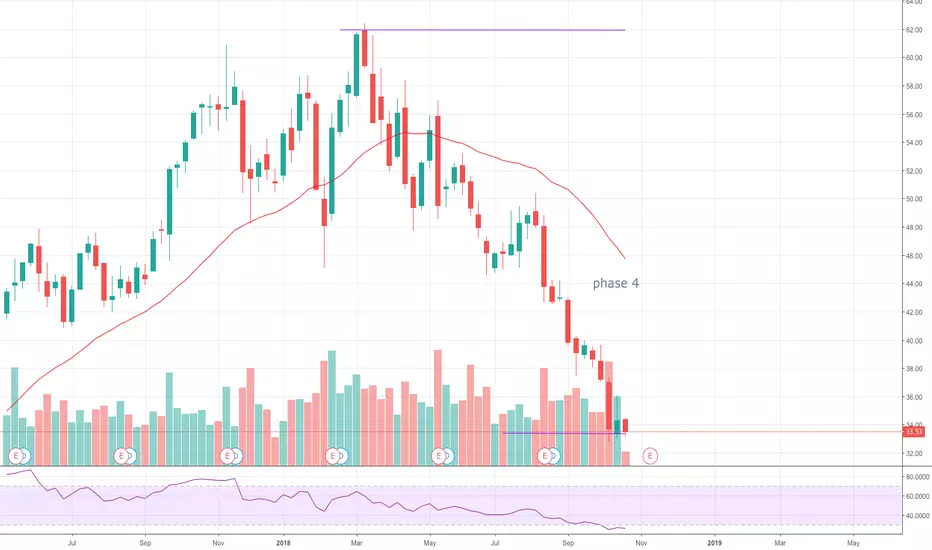
[AMAT] phase 4: Don't buy!Phase 4 in NASDAQ:AMAT . El price is so low in comparison to the MM30. The RSI is low too.


I took a shot on $AMAT ... See why!SO i like the morning star reversal candlestick pattern forming at previous support dating back to 04/13/17, and the recent crossover on the stoch. Tight Stop in place. #GLTA


New Strategy. Looking for Good dividend paying stocks on top of my oversold stocks that have been performing well this year but have pulled back to the 200day ema. If you look at the weekly charts instead of the daily, it is possible that this stock could fall into the 30$ range. Up potential of 40% with dividends to collect.
AMAT: Bull Flag?AMAT is currently setting up in a Bull Flag on the weekly chart time frame.
The Flag pole here is about $50 in length and so any Flag breakout could be expected to extend by that order of magnitude.
Watch the weekly chart Flaf trend lines for any new breakout.


Could We See A Pull Back In AMAT Before Retracement?Looking at the weekly chart, it appears we are hitting resistance at the 23.6% retracement level. RSI is flat and MACD isn't showing strong momentum, so for now, I am waiting for the pull back.
If this fails to break, we will look to retest support around $45 before this thing is ready to retest ATH near $62.
Will wait for confirmation higher/lower before entering JAN 2019 long call position

