AMAT trade ideas
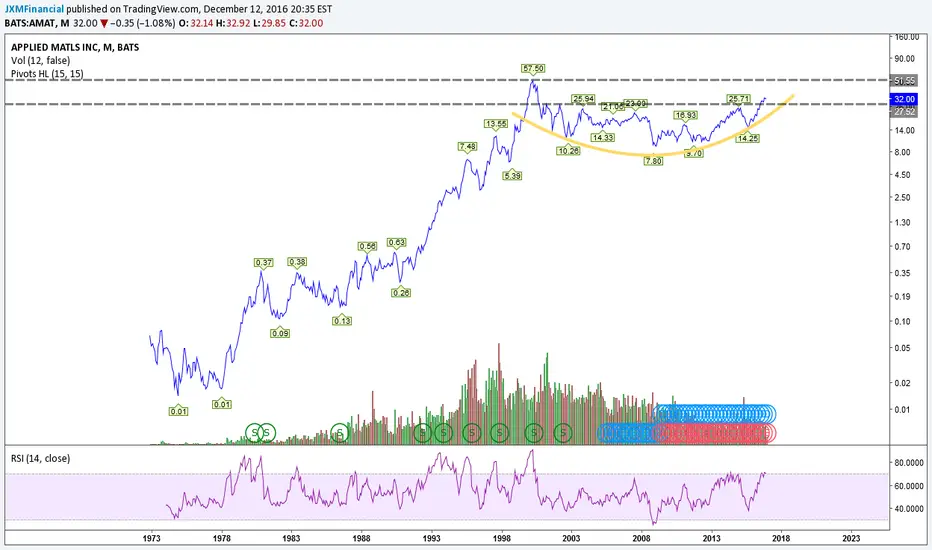

$AMAT - MonthlyThis looks like a great short set up to me. Tagging R3 on monthly and 2.272 fib ext. Williams R indicating sell. Most likely we see this tank on ER today.

Expected to test support zone before resuming 13-month uptrend11-11-2016
AMAT @ 28.28 – Expected to test support zone before resuming 13-month uptrend
AMAT rallied 13 months to reach 31.07 (September 22, 2016 high) before consolidating. The pullback so far has been benign, down 11% to 27.56 (October 13, 2016 low). As the momentum indicator remains neutral, the stock is expected to consolidate further towards the 26.00-27.00 support zone. Beneath lies the key retracement of 38.2% of the 15.44/31.07 upswing at 25.23. As far as the key support area holds, scope remains for resuming the year-long trend back to 31.07. An upside break above the latter would confirm the bulls are back in control for new highs.
However, a downside break below the 25.23 area would suggest more downside towards the 23.40 area (50% of the 15.44/31.07 upswing).
Outlook:
Daily: neutral
Weekly: bullish
Monthly: bullish


Price is at the round number resistanceAMAT is a stock that has been mentioned in our trading community a fair few times. It has been trending well but hesitating around the $30 round number.
Support is just over $1 away so a tighter trailing stop may be required to lock in profits for the Dynamic Traders who have positions in this.

Applied MaterialsDemand Zone at former resistance on the daily chart signals a good long entry
Entry: $27.68
Stop Loss: $27
Target: $29

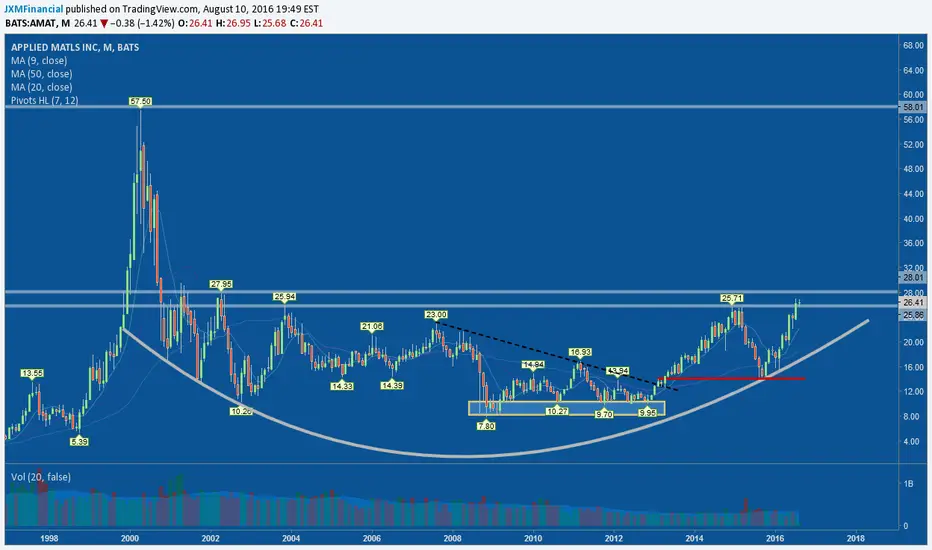
One of the few must owns (base 2 BO)Over 27.95 has blue sky for a major bull run. Buy signal triggered > 25.71-25.94
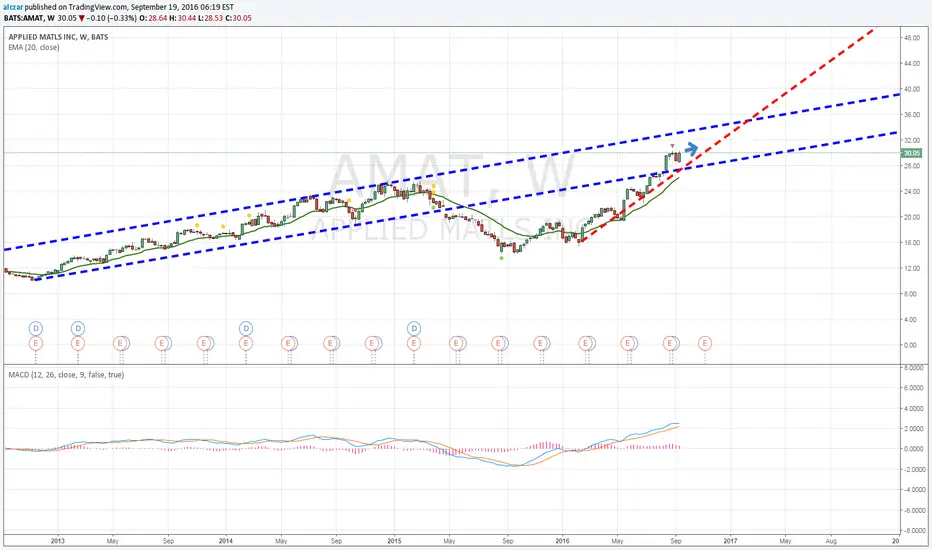
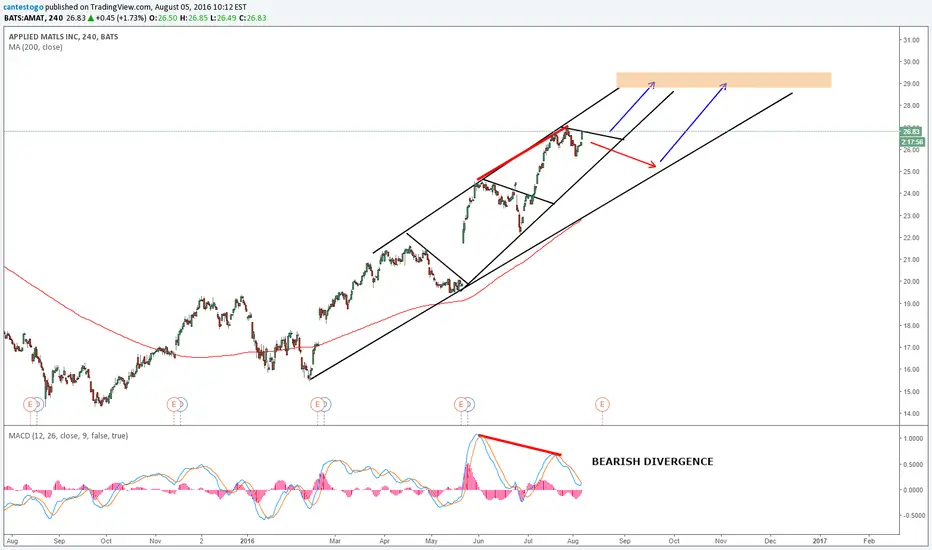
AMAT - APPLIED MATERIALS POSSIBLE UPTREND CONTINUATIONAMAT is in a strong uptrend. At the moment there is a bearish divergence for a possible correction but i'm expecting more upside. A breakout on rising trendline could be a strong retrace. Possible target on chart.

AMAT Higher Lows & remains on a solid BUY Signal. Can remain embedded Overbought for a while. Higher.

NOT True.. Trade any direction if the conditions prevail.Huge potential every day is left on the table. ie profit
Manage your trades in small portions in line with your risk management rules.
This is an up trend yet there are and will be many opportunities to short this stock.

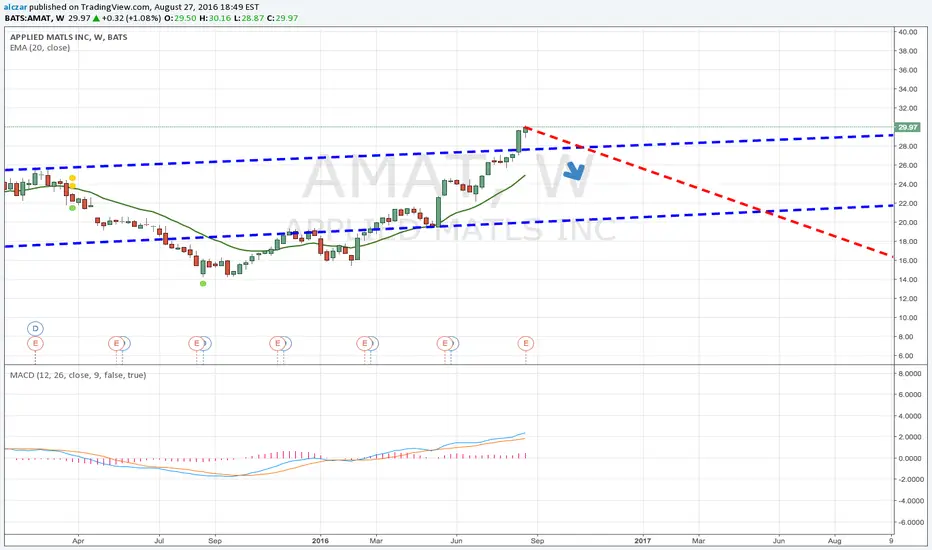
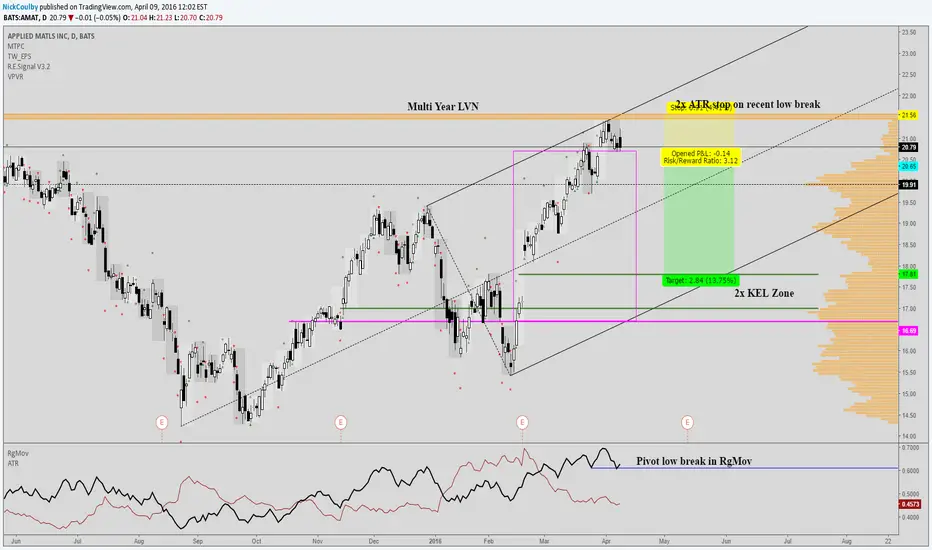
Daily short setup in Applied Materials, Inc. AMAT has hit a major LVN, as well as a major pitchfork upper outer band. With the Weekly TAM uptrend price projection being exceeded and expiring in 2 weeks, a sell-stop under the recent pivot low (20.65) with a target of 17.81 could produce a nice short play.


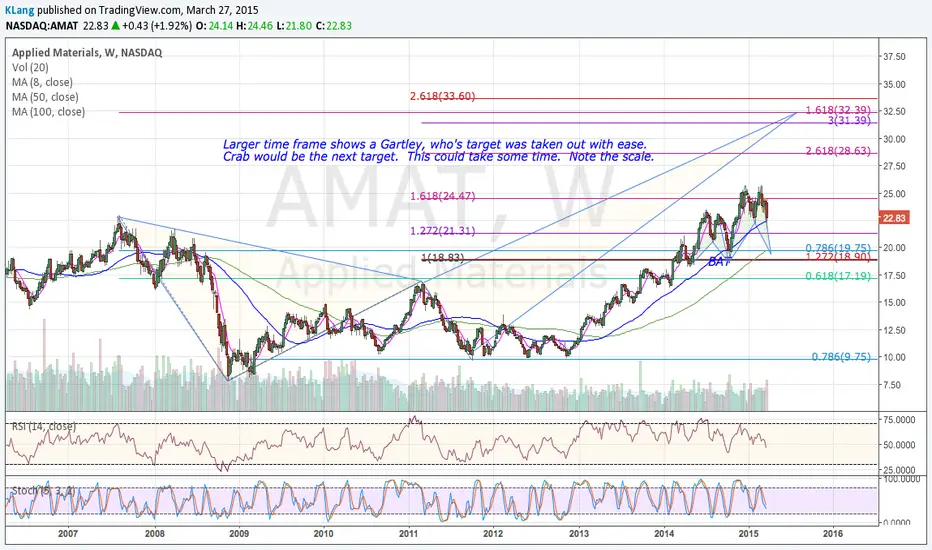
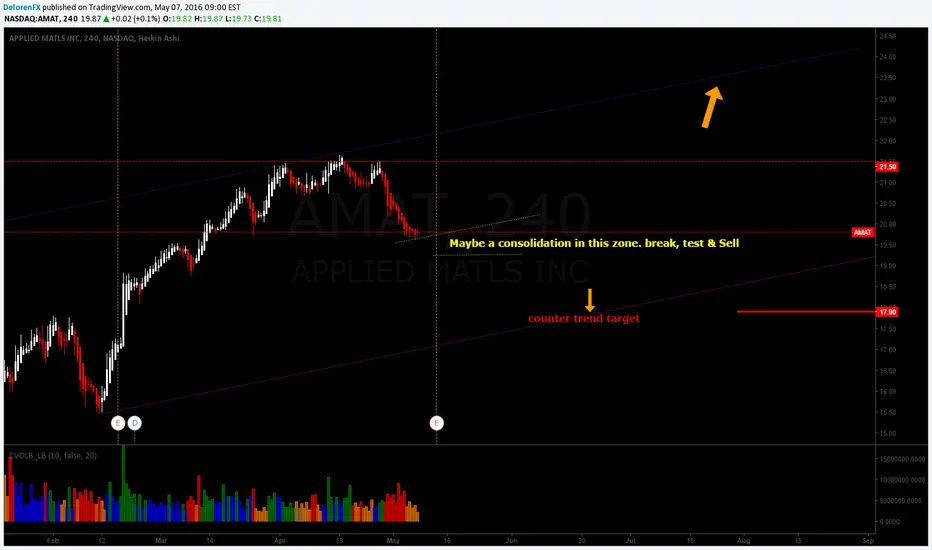
Could this be an Ending Diagonal in the making????? We have multiple setups here. On the lower time frames we will be trading within the structure. If it breaks the trendline and consolidates it would be an "abc" correction with targets of $17.00

AMAT Long - Betting on the ReversalAlthough the support level is shown on the weekly chart, also notice the MACD divergence on the daily chart.
Using a soft stop loss of $0.50 and a hard one of $1, I'm looking to make $2.50 per share for a 5:1 reward-to-risk ratio. Not being greedy, the profit target is even lower than $20, although climbing above that isn't unlikely, should the reversal occurs.

Applied Materials - New highs probablyThe weekly chart is in a clear uptrend. After a bearish divergence, price returned to value, and just got oversold. The high volume week warns of a selling climax (after a very short fall).
On the daily chart, there is a double bottom with a false breakout. The doji labeled on the chart has very high volume, a rare occurrence that really adds weight to the doji. The volume indicators point to oversold, as the wave volume is climactic and the Force Index is climbing back into its channel.
Note that both impulses are red, which makes this trade dangerous, however the risk reward is very attractive. One could enter directly on the open (me) or could wait some more time for a blue daily impulse. If the stock gaps down on Monday, I am going to wait for a blue impulse as well.