Possible Iv H&S on AMATThere is an In H&S possibly forming on AMAT. The target is around the .786 fib retracement to ATH.
AMAT trade ideas

AMAT BottomingNothing special here but AMAT is struggling the fifth day with the current level.
Of course this may be a consolidation level. Therefore a bet on an upward correction must be combined with a tight stop.

Support HeldThe end September low has just held. Due to the steep decline last days I can imagine an attempt to test the highs of past week again.

AMAT Potential Selling OpportunityThe U.S. Department of Commerce announced Tuesday that it plans to prevent the sale of more advanced artificial intelligence chips to China in the coming weeks. The U.S. government says the new rules are intended to close loopholes that popped up after last year's restrictions on AI chip exports went into effect.
If the U.S. restricts or closes the leeway that allows Chinese companies to access American AI chips, it can disrupt the global semiconductor supply chain. Applied Materials is a key player in providing equipment and technology for semiconductor manufacturing.
A disruption in the supply chain or reduced demand from Chinese customers could negatively impact their revenue and stock price.
Cycle Sniper is about to send the sell signal on the weekly chart.
After a potential breakdown of the ascending trendline and closing below 130 $ , stock price may go to 122 $ and 110 $
Good Luck

$Amat met all the criteria to keep going up✅Created demand zone below
✅Retested that zone
✅Crossed above the resistance
I am bullish on this. Target is 155.46 and stop loss closing below 141.20

The goal of reducing 60$According to the Butterfly pattern, the Fibo perfectly converges the decline to the target of $ 60. We also go down the channel where the lower border of the channel will be. All 3 parameters should be added together. We should reach it by May 2024, there will be a great point for going to long.

AMAT Applied Materials Options Ahead of EarningsAnalyzing the options chain and the chart patterns of AMAT Applied Materials prior to the earnings report this week,
I would consider purchasing the 130usd strike price Puts with
an expiration date of 2023-11-17,
for a premium of approximately $6.30.
If these options prove to be profitable prior to the earnings release, I would sell at least half of them.
Looking forward to read your opinion about it.

$AMAT - Are we there yet?NASDAQ:AMAT - A great company with a great future.
The weekly chart suggest a measured move at play to $167.xx and change.
The move coincides with a Double Top as well. So a question remains - are we there yet? Well time will tell!

AMAT Entry, Volume, Target, StopWhen price clears: Safest: 132.06 Riskier: 128.32
With average daily volume.
Target: 140.50 area
Stop: Depending on your risk tolerance; 124.28 gets you 3/1 Risk/Reward from 128.32, 129.25 gets you 3/1 Risk/Reward from 132.06.
This trade idea is not trade advice. This swing trade idea is strictly based on my ideas and technical analysis. No due diligence or fundamental analysis was performed while evaluating this trade idea. Do not take this trade based on my idea, do not follow anyone blindly, do your own analysis and due diligence. I am not a professional trader.

$AMAT with a neutral outlook following its earnings #StocksThe PEAD projected a neutral outlook for NASDAQ:AMAT after a negative under reaction following its earnings release placing the stock in drift D with an expected accuracy of 85.71%.

breakout watch target $170I'm interested because of the potential AI and Nanotechnology aspects. It provides chip manufacturing equipment and more services. Looking at the set up, I see multiple moving avg set to cross the weekly spike level


AmatThis one has been a sweet trade for me. I didn’t get to post about it. Howver curently we are on a breakout of an uptrend channel. We are in a smaller correction 138 is big support of this potential smaller flagging considlation. If 138 breaks down I’d be buying the dip arpund 136 as a beck test of the channel breakout. If we pop 143 and hold as support then another leg up should contiue. I’m remaining bullish on Amat. Dips should be bought as long as we are above 133

AMAT Entry, Volume, Target, StopEntry: when price clears 138.80
Volume: with daily volume greater than 7.76M
Target: 149 area
Stop: Depending on your risk tolerance; 135.41 gets you 3/1 Risk/Reward.
This swing trade idea is not trade advice and is strictly based on my ideas and technical analysis. No due diligence or fundamental analysis was performed while evaluating this trade idea. Do not take this trade based on my idea, do not follow anyone blindly, do your own analysis and due diligence. I am not a professional trader.

Bullish Flat#AMAT possible B wave overthrow I would wait to see if this plays out to be flat and then I am long.

Massive Breakout with the Arrival of the Golden Cross - AMATThis is a once in a lifetime opportunity to buy Applied Materials, a wide moat semiconductor industry stock which is undervalued. The stock is now ready for a massive breakout!

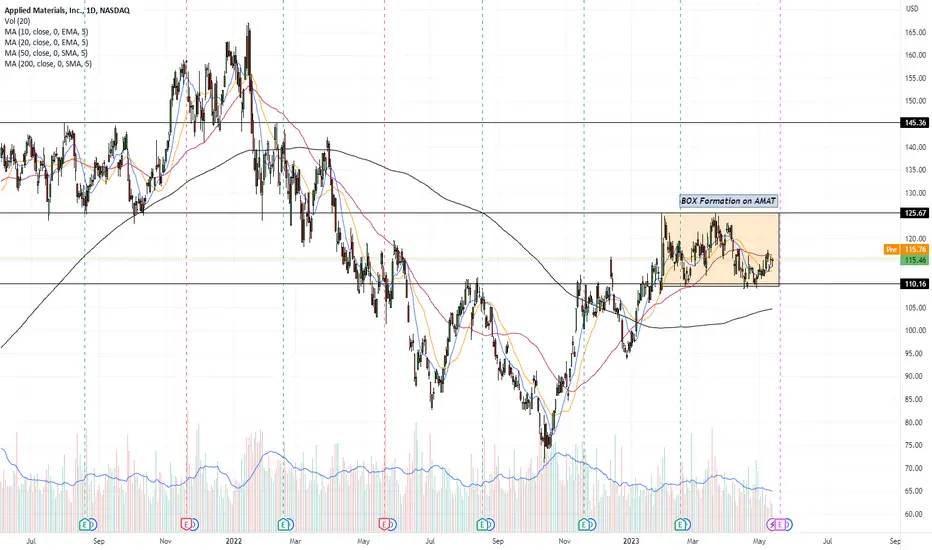
AMAT possible BUY opportunityAfter successful GOOG and CRM buy, my eyes are on AMAT stock- Applied Materials INC. Company operating in Technology sector. Stock price is currently consolidating in a $110.16 to $125.65 price range, forming a valid price Box. Box in price stock has become well known from Nicholas Darvas epic book called "How I made $2.000.000 in the stock market".
Things to consider:
1. This price range is good and the main reason for it is that the price is currently sitting above 200SMA on Daily level, and on Weekly as well.
2. Price is currently trying to break above 50SMA level on Daily, sitting at $116.52. If price manages to break the 50SMA level, I am consider buying couple of shares just to be in the game.
3. The best buy situation for me personally would be the break above price level sitting at $125.6 level and that will be my safe buy zone.
4. Of course, nothing is certain in markets, especially now, so my Stop Loss level will be sitting at $115.8 which is if you look at the chart now just below the 50SMA line on the Daily levels.
5. $125.6 price level is at the moment acting as big resistance level for the price, this is why I will consider the break above that level as safe buy zone.
6. If my order gets triggered I will be looking at $145.36 level as potential add to position/close with profit area. Depending on what the market does, my action will be following the overall market.
Just for everyone's thoughts, this is not financial advice and I am not a financial advisor, please do your Due Diligence before investing your hard earned cash.
AMAT ,,, Buy opportunity Uptrend
Its passed a major price level and ready for getting another target at about 168
As always do not forget setting SL at a sure place.

AMAT plans to grow by 33%AMAT signaled a trend reversal with the shoulder-head pattern formed at the bottom. the neckline broke above the one-year exponential average and a rectangle pattern is forming above it. 33% growth can be expected by sticking to our 4.13 stop level.

AMAT in FIB Golden PocketFull bullish reversal looks like on the way
The fib golden pocket is from the range 120 to 131
The current position after good earnings can push it for the full bullish reversal to the previous High of 166 ?

AMAT inverse H&SLooks like a successful break of inverse H&S neckline. Target of $151.
DYOR and trade at own risk

AMAT - Up IdeaAn up channel is evident which I think will continue with strong bullish runs.
I have used my pattern counting method to show the pattern I am looking at.
Corresponding points in 1,2,3

Short AMAT @ 113.49 Breakout FractalAMAT is just below the daily Balance Line, and just above the weekly Balance Line.
Price crossed a couple days ago the last daily fractal and tested the Balance Line and failed to cross it. This presents a good entry opportinuty.
The weekly presents good accumulated energy to be used in a down move.
Stop loss is price closing above the Balance Line (red). Target is whenever the trend ends, which is also signaled by price closing above the Balance Line.
