AMC AnalysisPrice played out nicely as analyzed, giving us a bullish retracement and now coming back down following the bearish order flow as expected. From here, since price has swept the liquidity above 4.78, I'd like to see a clean break below 4.01 for price to continue lower. If not, I'd expect price to consolidate for a bullish break of market structure.
AMC trade ideas

Hammer on the weekly and a real tight bollinger bandWe just printing a bullish hammer on the weekly, not dislike the one we printed before the big run. I also noticed the weekly OBV showing a similar pattern as well, where it goes up then pulls back before the hammer.
If you turn on the bollinger bands on the weekly, you'll also notice the tightest range ever seen on AMC - indicating extremely low volatility - which is typically followed by a big move. (this chart is a logarithmic chart so i couldn't show the bollinger and the hammer at the same time).
Have a nice weekend!

AMC - Price fell below all time lowAmc is not looking good. Price fell below its all time low of $10.35 on the monthly time frame, and is currently at $8.62.
Amc tested this level several times in 2020 (orange horizonal line,) but never did it close below this level.
There's 22 days left in September so there's still time for price to close above $10.35.
If price closes September below $10.35, we then would need October's candle to also close below $10.35 to confirm a possible fall into no man's land.
I call it no man's land because there's no support under $10.35, and price could literally fall into the pennies. Not saying this will happen, but with no support left, AMC needs to close the month over $10.35 to get out of this quicksand.
Looking at the RSI and Stochastics, when both indicators dipped below their white horizontal lines at the same time (purple circles,) this was a good time to accumulate.
Both accumulation periods resulted in over 50% rises.
Currently the Stochastics has started to break below the 20 level, and momentum is falling. Also RSI is not far from over sold territory, marked at the 30 level.
The reality is if both of these indicators dip below their white horizontal lines, price may also continue to free fall.

AMC AnalysisPrice played out nicely as analyzed last week, giving us a -15.05% move to the downside. No changes to my expectations, I'm expecting a continuation to the downside unless we get an increase in volume after taking significant sell-side liquidity.

AMC is finally at the bottomLook at this pattern. Every time since 2023 flat portion after each drop is smaller and smaller. I am betting tomorrow will be the end of the pattern!!!! And it needs to change.

RISE OF THE APES, the algo hits again.we learned alot from APE, that there was big players and an algorithm.,.. lets see what else is there

CAN AMC BECOME A 200 BILLION DOLLAR COMPANY?we talk about the charts and guidance here, Adam Aron will need to go on the offensive..


amc and macro bull flags, the case study...the case is there, this wasn't a pump and dump... but we are in a sinking ship.. for now

AMC AnalysisPrice played out nicely as analyzed last week, giving us a -15.59% move to the downside. Since we are currently in an all time low scenario, avoid catching the falling knife and wait for a bullish confirmation before going for a long. I'm still expecting price to continue lower from here.

we are almost there... amc payday.. planthis is just speculation and a plan... lets see what we can do.

5.20 AND THE MAGIC TRENDLINE FOR AMCcant believe my eyes guys, we are almost there.. the gloryland awaits us!

Intuition Stock AMC tgt $19Ok, believe it, or not, I did get AMC as a stock to "pay attention to" when I mentally asked for one from my intuition on Monday.
I don't follow this, and wasn't even sure where it trades, but the number 8 came in pretty strong, followed by the number 19. I thought the timing of receiving it was neat because it had earnings in only a few days, which was last night.
My little intuitive symbols on Monday showed a down and then up, so I figured I'd watch and see if it got to $8.
When I finally just checked on it, it was down this morning 19%! The low in premarket? $8.00 even. It's recovered some, but still down almost 14% atm.
My follow-up with dowsing indicates the "big idea" and "best idea" is it's "safe and profitable to buy" (twice!). Last time I got that was on 10/26-27 asking about the Qs or SPY. We know how that turned out.
It's suggesting I get a date, which is December 18th (Mon.) and I think that's the trade exit. I'm not very practiced with dates for entries and exits though, and when I try them, it's often not the actual entry. It can be news or some reversal, however. Maybe it's be correct this time, who knows? I would definitely give this some time to play out though, and expect the $8 area to be support.

diamond target hit 5.20.. whats next for amcwe predicted this leg down,, but is there more downside? likely...

AMC now versus Solana summer of 2022 dropSolana bars from summer of 2022 to present overlayed with AMC.
I remember when Solana tanked to 8 bucks and wondered if it would ever recover.
Now, AMC is showing the exact same trend and it has people feeling the same way I'm sure.
I sure wish I had bought Solana for $8...
Good luck folks!

amc needs to change fundamentally.... now is the time..in this video we do a bit of TA, and charting, but also talk about the prospective impact of what amc could be..

AMC - still positive !To be honest I just like to draw lines. Looking at the history of AMC nothing is impossible and there is a turnaround point. I don't see it go below 4.90$ but we need a strong reaction soon!

AMC AnalysisPrice did not play out as analyzed last week. Right now, I'm expecting price to continue lower from here with the peak in volume. As price is in an all-time-low scenario, I'm expecting a continuation to the downside and avoid catching the falling knife.

It's allll good (perhaps)Above you can see AMC's 4h chart.
As you can see, we have broken above the heavy macro resistance , which dates back to April '22. We even retested it and found support today.
No dates, no price targets. Just showing you the TA I'm seeing here.
RSI is also oversold on the 4h and volume is picking back up.

AMC happy new years updateBullish daily Rsi
Falling price action
Need to find support over 6.80
Several upside gaps that need to be filled
We’ve also broken out of a falling wedge with a possible recovery back to $11 plus

triangles and colors.. lets talk amc...we are close.. we have to be right? lol. hopefully i see u guys on the moon!

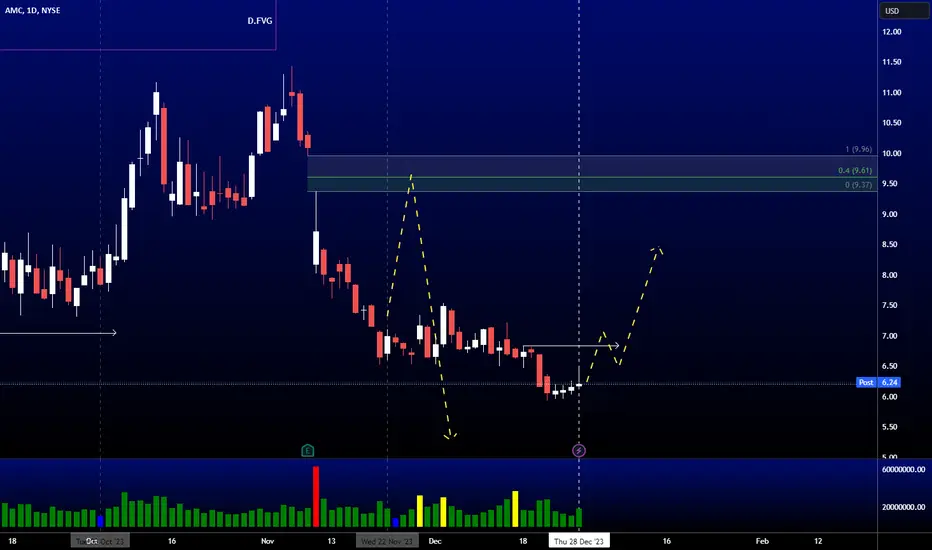
AMC AnalysisPrice did not play out to my last analysis of filling the FVG at 9.61. Price is consolidating since my last analysis and is showing bearish order flow so far. I'd like to see price breaking market structure to the upside, starting at 6.84 and price respecting the newly created bullish OB before we see price reverse from here.