AMC trade ideas
Ever wish you could buy at the SMA100 price?https:// www.
https:// www.
https:// www.
https:// www.
Recently I have been wondering; why do so many people trade exclusively on the SMA cross? It's fairly obvious that placing a single trade at the golden cross with all your capital is a good way to lose quick. Are there more advanced strategies that have fantastic results? yes. However today I am not going to be focusing on those. Today I am showing that even basic technical analysis can work when it's done right.
This strategy measures only the sma100, and the average position entry price to place trades that have a statistical probability of closing at a Net profit. By setting a profit target a few percent above the average position entry, and only adding to that position to keep the average entry at the SMA level we are able to see consistent profits not long after golden cross events. On major indexes, currency, Tech, and even the more volatile meme stock. If you're new to technical trading this could be a great place to start.

AMC AnalysisI was expecting the price to retrace up and mitigate the bearish POI at 12.73 before going down. However, the price went down first. The target for this move is potentially to mitigate the bullish POI at 6.59, and take out the lows at 5.96.

AMC & APE - What are You, a Monkey?That old adage about "buy the rumor, sell the news" is usually pretty decent wisdom.
It's worth noting that the APE airdrop opened at $10 and fell to $5 over the course of one day, while at the same time AMC's stock fell by $8 to compensate for the value inhered in APE.
You might think to yourself that this doesn't really matter, but it does, because all AMC options yesterday traded under "adjusted" to include 100 APE in the contract. It wasn't until today that a Sept. 16 AMC-only option appeared.
But in the course of the next day, while APE went up $2/20% to a plain ~$7, AMC itself has dropped below its May lows and the psychological $10 level, and is well on its way to revisiting 2021 prices.
This is yet another case illustrating the perils of following the Fabians that run the Marxist Reddit communities.
They're not "bros" trying to help you get rich. They're paid public relations shills who are there to generate volume for the institutions paying their parent corporation to bring in dead money to sell their bags to.
Whenever a new stock hits the market, the original price discovery tends to be pretty bad. If you're lucky, it'll act like something like Palantir PLTR did, where it didn't really make any new lows:
Before actually going "APE."
But keep in mind the differences:
APE is a WallStreetBets frontran dumpster fire coin for a collapsing theatre chain in an economy that should really be classified as on the cusp of entering the 21st Century's "Great Depression."
Palantir is a major AI-based Pentagon-backed surveillance company with Peter Thiel rooted in it.
Or you might, instead, wind up like Coupang CPNG, which lost half its IPO debut price in two months:
Before continuing to die in a muddy ditch during the stock market's biggest bull run of all time.
Regardless, AMC is not going to moon. It's going to drop, and drop, and drop, and so is APE.
After you've capitulated your bags for pennies on the dollar ahead of the new memestock pump cycle 6+ months from now, you might see a significant high.
But if you do, you'll only hear about it on Reddit after it's pumped, because you're supposed to buy high and sell low while Citadel sells high and buys low.
That's what they pay Reddit to do, because it's not a social media site filled with sexy college girls taking off their shirts because they like your attention, but because it's a social marketing and social influencing site where you're the product that is to:
Lose money
Intake a lot of porn
Carry water for the establishment leftist narrative
Be indoctrinated with Marxist-Leninist atheist junk
Additionally, you should really give some thought to being called an "APE." What are the implications of this term? That you're a low IQ animal who mashes the buy button with reckless abandon to "punish" hedge fund short sellers in some kind of rebellion against your father?
Don't you have any self respect? Don't you have any pride as a human being?
Why would you position yourselves alongside garbage like this?
This is the crux of the test, and Heaven is observing All.

AMC Is Ready To Pounce....Golden cross is close on the daily...
W pattern on daily from all time highs...
Will Orange Resistance line....
Will play out similar to 12-21 may 21'

What else?AMC has closed the month of august on an inverted hammer candle. Bullish divergence on the 1hr. Like that's not enough, a falling wedge appears out of nowhere.
$APE ftds caused the security to be put on threshhold. More than 2.5m shares FAILED TO DELIVER.(I believe it's way more lol)
I wanted to stop posting on AMC but things are getting pretty spicy.
So much going on around this company and the stock.
New single-stock-short ETFs are being pushed out. A way for the out of the money puts to hand over their positions to unsuspecting retail traders and investors while and all while pushing lies through media and trying make apes sell. Little do they know, the apes have removed the sell button in 2021. Bring it on!
I now believe that the squeeze will happen this month. Too much publicity will cause for retail to FOMO in and if that happens, nothing will be guaranteed. $AMC stock price will do backflips and reach stupid numbers.
Stay focused. Stay zen. See you all on the moon, my friends.

Summary -Reversal Trend-downtrendAs you see on the chart we have a breakout with force the vwap indicator and the resistance line by a big red candle with a large volume.Thanks.

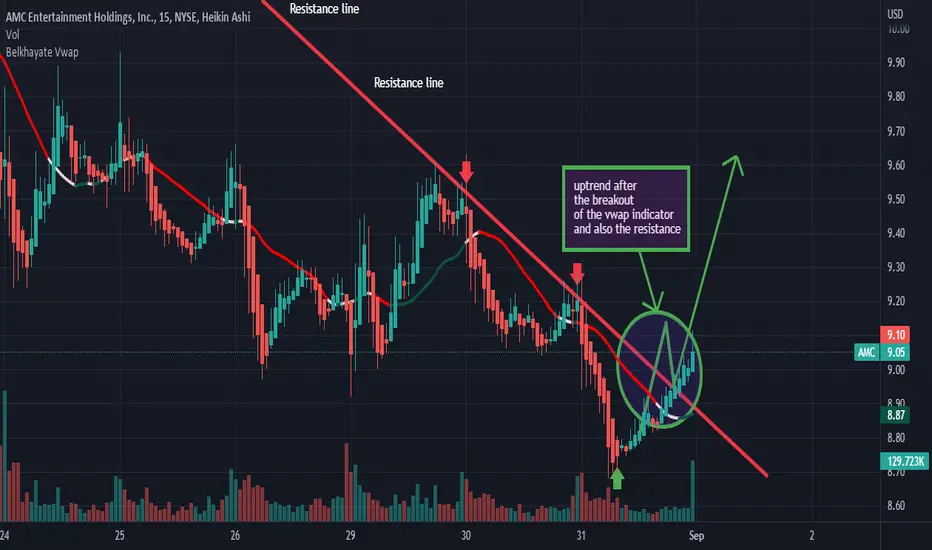
Summary on AMCHello! As you see on the chart buyers are broken the resistance line and the vwap indicator.Thanks.
Inverted Hammer on the Monthly CandleThis is the endgame, ladies and gentlemen. This will probably be the last time I post on AMC. If the cycle plays out inverse, starting on monday the 29th, we would see a retest at around 6$, which prior to the split would have been at around 10$.
We either move up now or after the retest of 6$ which I believe to be unlikely.
In my honest opinion, I would suggest us to be in the last stages before we finally to up for good.
See you all on the moon. Stay zen.

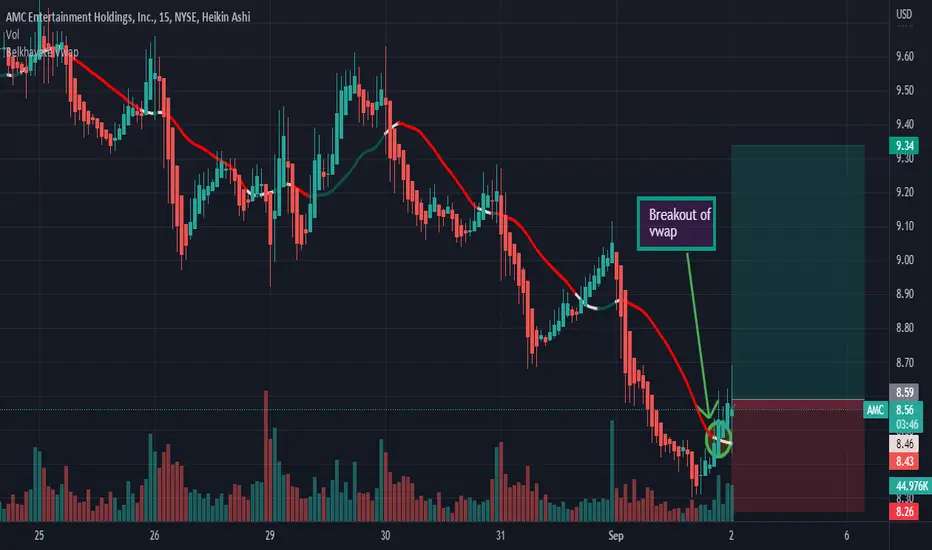
AnalysisAs you see on the chart we will have a big probability of an uptrend after the breakout with force the vwap indicator by a big green candle with a large volume.Thanks...

Fake Out BottomWell, the breakout to the downside is not good. Maybe this has to do with the new ETF's?
I will be watching closely at the RSI and OBV over the next week as the saving grace is they don't seem to match the move to the downside.

Daily Candles on AMCDon't shoot the messenger. I am not a professional.
I think you are going to see a breakdown of AMC to about $6.15. The last three candles on the chart is a bearish formation, it recently broke its trendline and there is no buying volume. It is at a heavy resistance at around $9.70.
There is also the subject of parity with APE. Where the 2 prices meet in the middle and trade together. APE is very low right now and if there is a parity it would most likely be in the $6.50 range.
All opinions are welcome!

amc bounce memes look ready!amc creeping into demand zone looking to pick up equity in the demand zone around 9$ let me know your thoughts in comments leave a like and follow please! and check BIO

DowntrendAs you on the chart we have a breakout with force the support line and the vwap by a big red candle with a large volume. Downtrend.

AnlysisHello everybody!!! How are you? Good i hope! God bless!! Today as you can see on the graph we are in an uptrend and we are not going against this trend. In addition, we have a spring effect on the support line. This means that we have a very high probability that the market will continue to rise with strength especially if we also have the break of the resistance line by a large green candle and followed by a large green volume. But, it is advisable for us to be vigilant because there can also be a reversal of the trend if and only if the vwap indicator as well as the support line are forcefully broken by a large red candle and accompanied by a large red volume. Thank you for your attention.

AMC B breakout $ we need to hold above our ascending line and above the 9$+, to confirm the bullish momentum and break the 10$+ level , in order to get 2 profit taking , around the 11.17$, and the 12.90$+.
if we broke this ascending line below the 9$, we going to see a huge short momentum to take us to the 7.70$, and the bottom of this year if we didn't hold that support is the 5.50$+.

Possible AMC BottomWhat I've done is adjust the upper trendline and illustrate the gap down. There was a prior golden long-term demand zone which has been copied down to this adjusted technical analysis.
It looks like there is a rejection off the prior upper trendline that extends back to the gamma squeeze last year. Because the RSI is largely oversold and the OBV is bottoming out, we may see some uptrend here in the short term. But importantly, this bounce is going to illustrate if we will see bullish consolidation or not.

Combined value of AMC+APE daily candlesIf AMC = APE then why not chart them together? Is this a Cup and Handle?

MERRY MOASSFractals are color coordinated, seems to be in a significant point in time regardless of the -13% day we had today.
This is my last AMC post. Power To The Players.

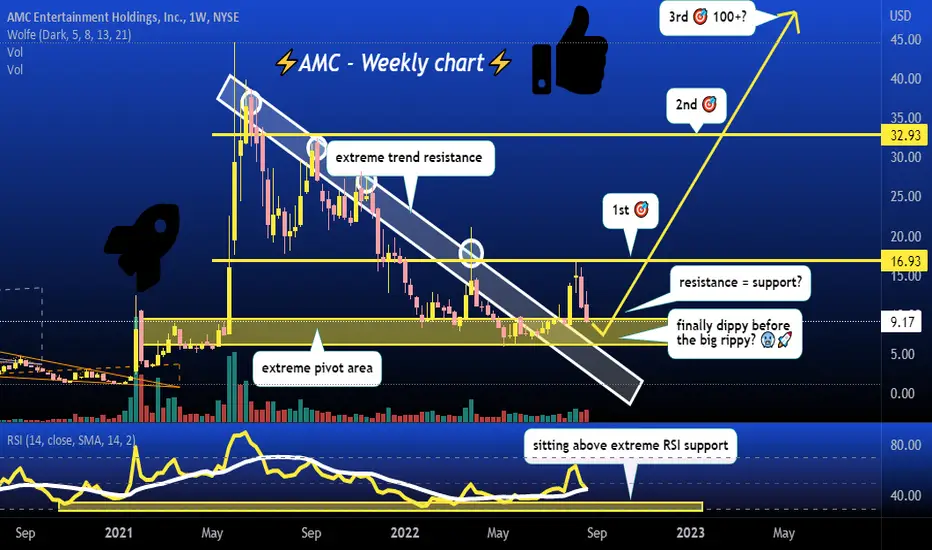
resistance = support❔ bullish if we bounce here! ☘bounce from previous trend and pivot area will be a good sign for bulls, I expect parabolic bounce to 16.93-32.93-100+ 🚀
lets go my fellow apes! to the moon
V shape recovery for amc ape's win lizards looseUsing the Log we can see the V shape recovery... we got a little taste of what the future holds. i agree with all the wrinkle brains, smooth brains, tin foil peeps, and company management. these guys tried to sink this stock and retail was not having it. in life you find a movement and get behind it, like bitcoin amc has a culture that will not allow it to go away. it will be here for many years to come, add this to your roth, triple digit price i see. NFA. peace, one day major spike up.


Big probability of an uptrendHello! As you see on the chart we have the breakout of the resistance line and the vwap indicator. So, it's mean that we will have a big probability of an uptrend. But, we can have also a continuation of the downtrend if we have the breakout of the support line. Thanks.
