AMC Breakout $ Target we going to confirm if this not a fake out if we hold above the 16$, or above the breakout triangle , first resistant we going to test is around the 20.50$, and the second one , which is the squeeze level as well if we broke it and hold above , which is above the 29$+.
NYSE:AMC
AMC trade ideas


Pray to your Gods for this is not a human matterI expect sideways movements for a day or two. After that we should be seeing 19-21$. If support holds, which I‘m sure it will, we are on our back to 28-32$ range. Everything beyond that is pure speculation. No one knows how high this will go. After extreme pressure from mainstream media trying to shake us off, I believe even more that this will be a once in a lifetime oppurtunity to redirect many of our lives. This is far beyond simple TA. This is far beyond anything we can imagine. In the end, the diamond hands will chose their price since there is no limit on how high a stock price can go. Market cap is an illusion.
Youtubers who have been known as the faces of the Shortsqueeze movements are turning away. Probably paid off to make us sell at 270$ LOL. We didn‘t come this far to sell at brokie numbers. I genuinly believe we will surpass the 270$ prediction by at least a 5 fold. Even if there is no limit, especially with a short squeeze of this magnitude, weak hands will fumble the bag hard by selling too early.
Stay strong. Stay focused. Stay zen.
Ape out.


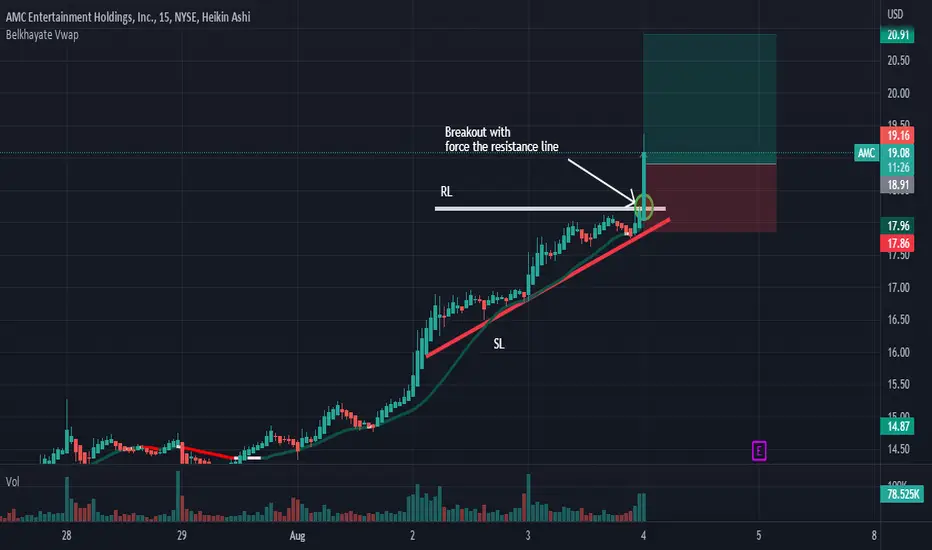
AnalysisOn AMC we have had a very nice trend over the past few days. Two conditions are to be seen for our analysis today. On the one hand, as you see on the chart if the resistance line is forcefully broken by a large green candle and followed by a large green volume, this means that we would have trend continuity. On the other hand, if the vwap indicator as well as the support line are forcefully broken by a large red candle and accompanied by a large red volume it implies that we would have a high probability that the market will fall.Thanks.
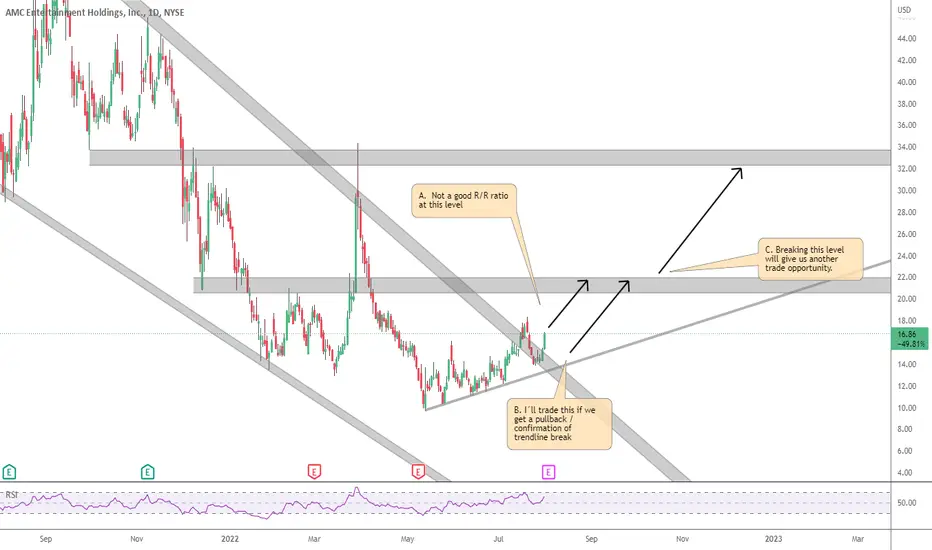
AMC - Attempting a trendline breakAMC has been falling in a clear wedge, and is currently attempting another breakout to the upside.
We have 2 important resistance levels: 20-22 and 32-34.
My trade plan is:
A. At current levels (16.86 as I write this), the R/R ratio is not good enough for me, considering 20-22 resistance.
B. If we get a pullback to 12-14, I may take a long trade depending on price action, with first target at 20-22.
C. If I don´t get a trade in this zone, I´ll wait for a break of 20-22 resistance, targeting next key level at 32-34.


Reminder of some analytical concepts example on AMCSince July 29 at 5:00 p.m. the vwap indicator has been broken and we have had an uptrend. In addition, on August 1st the market came to have a spring effect on the vwap indicator and starded to rise again. During this same day ( August 1st) we had yet another spring effect on the vwap indicator , thus pushing the market on a very nice trend.Thanks.

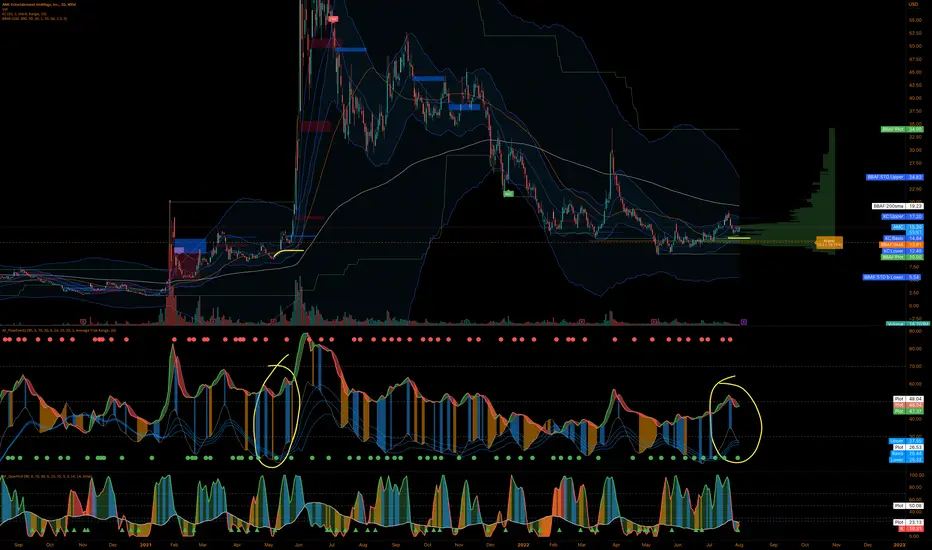
MACD Wedge Pattern on Weekly Chartpotentially awaiting a breakout ( to the moon?) after a good summer
theater season and converging MAs with earnings soon upcoming
as the catalyst.
Fundamentals:
Earnings calls
Upcoming
Q2 2022Scheduled Aug 4
PreviousEPSRevenue
Q1 2022Beat 2.85%Beat 5.69%
Q4 2021Beat 56.55%Beat 5.15%
Q3 2021Beat 19.13%Beat 4.07%
Q2 2021Beat 25.66%Beat 16.38%


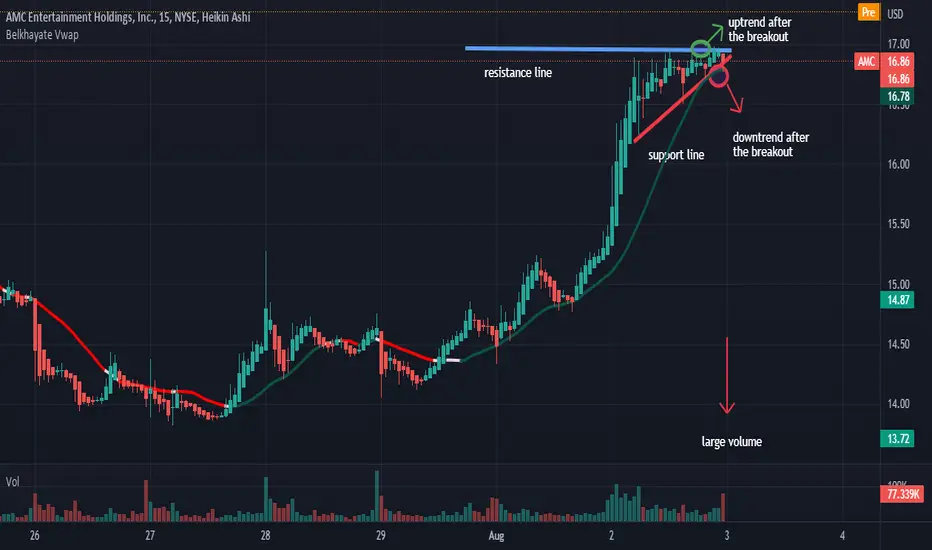
AnalysisOn AMC we can say that there is a balance between buyers and sellers. However, we would have a true uptrend if and only if the vwap indicator as well as the resistance line are forcefully broken by a large green candle and accompanied by large green volume. On the other hand, we would have a downtrend if the vwap and the support line are forcefully broken by a large red candle and followed by large red volume.Thanks.

AMC Squeeze ProjectionNot sure if a 'kite shape' has ever come up in technical analysis but for the sake of meta we can just say diamond. I think we will run sideways until the half point is tested where we will get a breakout to ~100. After that, since it would be at the top of a rising wedge, we would see a slow consolidation to test the extended bottom trend (orange) where we will see a push to another high point where the squeeze should occur (summer 2024).
If we breakdown, then its just wrong and I can see 5 being a bottom. I've been holding since Jan 2021 and plan to sell -if it works out- at 100 where I will wait for the end of the consolidation period where I will re-enter and hold for another year for capital gains (woohoo waiting!!)
Ultimate sell target: $1,000.00
I know this idea is based off the Short Swap theory present throughout meme stock talk. I believe AMC and GME are the most profitable and I believe the short swap theory is true. When the economy crashes, people will look for anything going up. And when the shorts exit, amc and gme will be that ticket to big gains - the initial cause for the squeeze. The top is impossible to chart.. 1k seems reasonable to me.
Good luck


