AMC slow and steady?Just a general idea, seeing as August calls are getting more popular because of movies plus the movies in that time period look to have better customer yield.. ?
If markets weren't so corrupt i feel that this play over 2 months or greater is completely possible, any good news will push this higher every time in this new bullish cycle!
NYSE:AMC NYSE:GME
AMC trade ideas

all in HODL MOASS AMC ROARING KITTYonce in a lifetime event.
#MOASS
Citadel shall pay for their sins

Meme stock alertInverse HS and bullish flag forming. It has already tried to break the 10-11 zone. I think is going to try again. I opened a small long position, not planning to risk much here bc is a meme stock. Just for fun. Also it could find some resistance at 7. Take some profit there.
Breakout for our favorite meme stocks $GME and $AMCTrying to shed some light on the potential path for both stocks and what levels im watching!

Dont Say I Didnt Tell YouAMC will follow GME, if you look at the larger time frame it is setting up a LARGE move.
Its exhausted to the down side, taking profit at 50% stock gain. wont do options.

Blockbuster move coming to cinemas near you?**Not Financial Advice** I have been wrong before :)
I believe AMC has a path to $16-$20 at the very least and fairly soon. It may retrace from there completely or to around $10 before going higher. To the moon target could be as high as $400 or more.

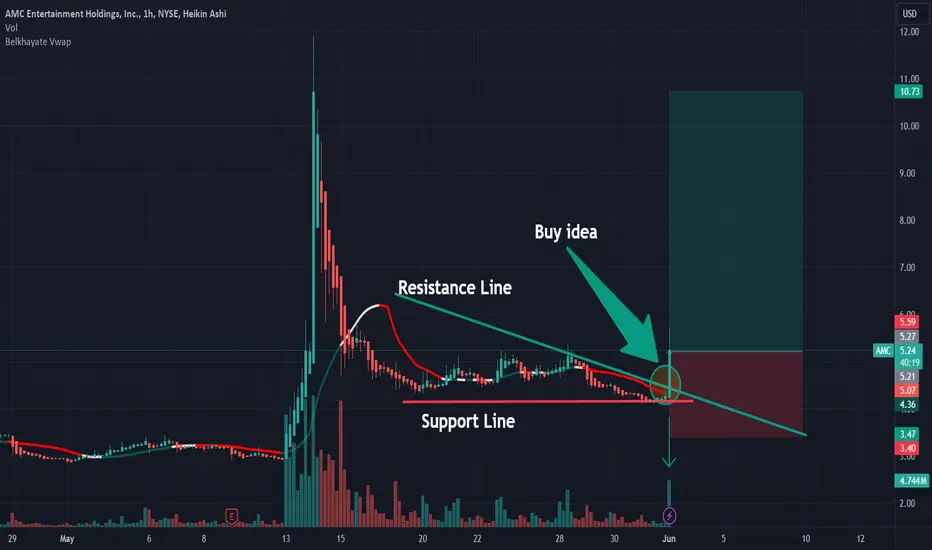
AMC: Buy ideaOn AMC according to the configuration on the chart we have a strong chance of seeing the market go up if all the analysis conditions are respected.
AmcAmc has hidden bullish divergence
flag pattern
low stochastics
I can see this stock at 14, 15 a share very soon

Short term triangle formation This short term wedge pattern will likely resolve this week. I'm expecting a breakdown to the 4.50 area and then maybe more upside. Patience may give the opportunity for a good entry point.

AMC - Week of June 17, 2024Its been a while since I published anything. I have been working on getting better at my skills and TA, just to be honest.
Two years later and AMC looks attractive again. Why?... Well it derives from a bunch of degenerate cultist (like myself) who believe in the stock / company, the evolution of what we know as the theater industry, and same fractal patterns reoccurring. Oh yeah, and the correlation of GME and AMC being exact.
So I will approach this PROJECTION (because thats all this is & NOT FINANCIAL ADVICE!) as a sympathy play to GME. See GME analysis on the next post.
I begin doing a top down analysis. Here is the Monthly view on AMC. Currently price closed at 4.99 on June 14, 2024. lol Cant make this up!
I simply see a Dumb Money sequel - Hedgies Getting Wedgies -
Coming to an AMC theater near you.
When we squeeze I see it AMC going to 174 - 154 per share price before it is met with great resistance and pulls back. Here is where the real test comes, we will see if with enough force AMC breaks this wall of Hedgies. Shall it have a blow the top off moment, it needs to stay above 195 to get to All Time Highs!
I could be completely wrong and it goes to zero....
NYSE:AMC

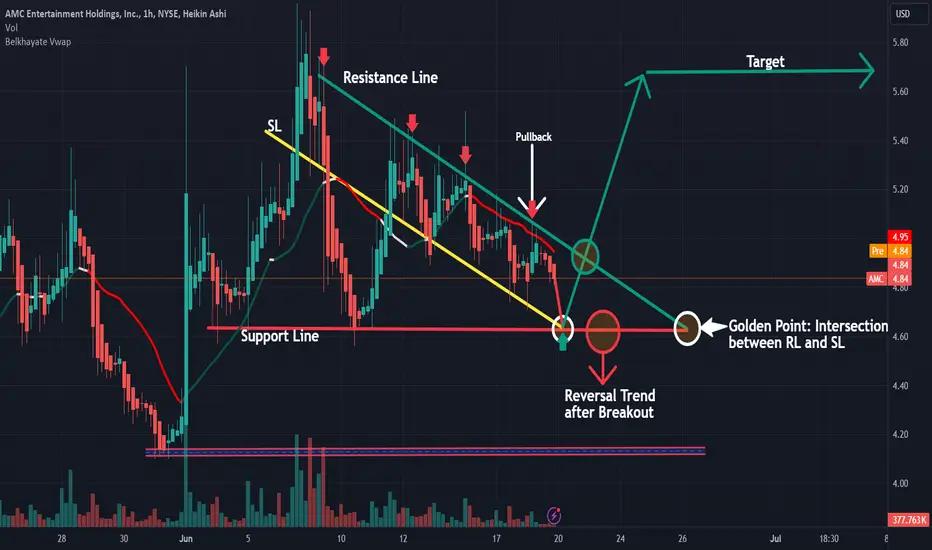
Wedges and Triangles for AMCLooks like a wedge or triangle is forming in AMC. My entry was pretty bad this morning, so I wanted to pass along what I learned today. Looks like AMC has another few weeks of relatively sideways movement before another significant leg up or down.

$AMC Descending Broadening Wedge FormationOverview:
NYSE:AMC is currently exhibiting a classic descending broadening wedge formation, a bullish reversal pattern that suggests potential upward movement. This setup is characterized by two diverging trendlines, with the price making lower lows and lower highs within the pattern.
Long-Term Target:
Based on the wedge formation, our long-term target is a move back to the top of the descending broadening wedge, around the ~$300 level. This target aligns with historical price action and significant resistance areas.
Short-Term Targets:
Before reaching the long-term target, NYSE:AMC is expected to hit several key resistance levels. Our short-term targets are in the $10-$15 range, where the price is likely to encounter the major resistance trendline.
Trade Strategy:
Entry Point: Look for entry opportunities near the lower boundary of the wedge, ideally around current support levels.
Short-Term Profit Taking: Consider taking partial profits as NYSE:AMC approaches the $10-$15 resistance zone.
Stop Loss: Set a stop loss below the recent swing low to manage risk.
Technical Indicators:
RSI: Monitoring for oversold conditions that could indicate a potential reversal.
Volume: Increased volume near support levels can confirm buying interest and potential breakout.
Conclusion:
The descending broadening wedge on NYSE:AMC suggests a potential bullish reversal, with significant upside targets in both the short and long term. Traders should watch for breakouts above resistance levels and manage risk accordingly.

AMC PullbackAMC coiling here near a key moving average after pullback from its initial move. Our premium indicator has giving 2 blue continuation signals + GME looks to be in a similar position.
Besides the risk of how volatile this name is, this play also has significant overnight risk. A realistic stop on the position is around 15-25% meaning the sizing has to be very low.

AMC RSI Bottoms highlighting a divergence?Looks to be a bullish rsi divergence with an rsi cross on the 3 week chart. I’m seeing a gap to fill on the weekly as well.

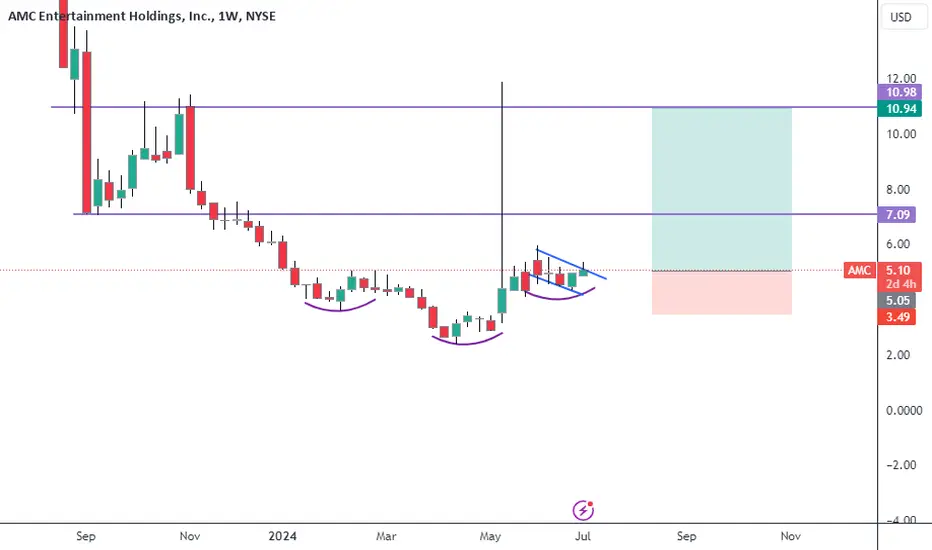
Future targets?@FlyingDutchman100 perfect parallel with the previous bull channel. There is a lot rhyming but its way to soon to be looking at this, pure speculation. The box falls in 1 Nov 2025 to 3 March 2025

Navigating $AMC: Technical Analysis Insights for the Week Ahead.Key Observations:
After market hours, the stock closed at 4.87, positioning itself just above the golden pocket as indicated by Fibonacci retracement levels from the lower low on April 26. Notably, support aligns closely with the EMA 20 at 4.72 and EMA 50 at 4.33, suggesting a potential further dip to test these levels.
Bullish Perspective:
Should the stock hold within the range of 4.59 to 4.35, a swift rebound is anticipated, targeting the range of 5.80 to 5.90. A crucial observation is the presence of a significant black trend line that the stock recently breached on June 3, potentially hinting at a retracement to validate this breakthrough. This forms a notable buy zone, coinciding with a potential gap fill. Additionally, a new bullish channel appears to be taking shape in the broader context, offering further support in this price range.
Potential Downside:
The RSI (Relative Strength Index) exhibits a downward pivot, currently residing below its average and testing the 50% mark. While there's no bearish divergence apparent yet, vigilance is warranted, particularly if a price bounce occurs simultaneously with the RSI forming a lower high, indicating a possible bull trap. A close below the newly forming bullish channel or the black trend line suggests a downward move to test 3.72.
Other Considerations:
The MACD indicator displays a pivot downwards, though it has not yet crossed. Similarly, the MFI shows a downward pivot but remains within bullish territory. Notably, there's a resurgence in trading volume, potentially signaling a shift in market sentiment.


AMC Approaching Decision PointIn the run up to the January 2021 squeeze, AMC struggled to get above the Daily (red) and Weekly (green) triggers. However, in the few days right before, those resistance points collapsed. Each trigger fell with a gap-up and accelerated price action to the upside. And each time the triggers turned from resistance into support and the next trigger fell.
AMC might be playing out the same process, though on a longer timeframe. AMC has currently bested the Daily and is creeping toward the Weekly. If upside price action is to continue, I expect a gap-up over the Weekly and a run to the Wave 3 target range, then a drop back to retest the Weekly. The craziest scenario in the short term is a run above the Monthly around $40 and a quick collapse back to the Weekly around $20. However, I think it will be more restrained and methodical with quick, unexpected breakouts until it finally conquers the Monthly.
This will almost certainly shadow GME as it squeezes over the next several months.

AMC, series of price growth expected.AMC is registering significant net buying at the current levels -- conveying accumulation for a higher valuation.
On the 4h data, 3rd higher lows was created suggesting upside continuation.
Volume has also also steadily increased this past few days.
Spotted at 5.0
TAYOR
Safeguard capital always.


AMC pumps price and volume into fair value zone LONGAMC is on a 4H chart with a set of VWAP bands overlaid In the past two trading sessions price
and volume have pumps and so also the PV Trend indicator. There is no fundamental
footprint on this move. it is a pure meme much like a similar move of GME. I will go long
here hoping to ride the momentum and capture profit. I will set a stop loss fo 10% n
recognition of the volatilit The final target is the $ 120 range pivots of April and
August 202. The initial target is the $35 range of the ranging zone of August 2023. Upon
reaching the first target I will cut the position to 50% for the leg higher. I will cut the position
if momentum fades especially if the volume fades with it. This will be interesting at the least
and highly profitable at the very most.

AMC - Signs of Life 👨⚕️Now that the AMC hype train has died down, I can start positioning on some lower risk trades. Been waiting to see this pop.
As long as we dont gap up on open, I'll be taking some here at the 618 - tight stop. If stopped out, will look for rebuys near pivot high. Any break of that and Im out.
Simple. Ez. Smooth 😎

AMC: Buy idea Buy idea on AMC as you see on the chart after the breakout with force the vwap and the resistance line by a big green candle follow by a large green volume.!