Are You Using Technical Indicators All Wrong?Most indicators aren’t broken. Most traders use them wrong.
Thousands of traders rely on RSI, MACD, and moving averages — and most of them still lose money. Why? Because they use tools the wrong way, in the wrong context, with the wrong mindset.
Let’s break it down:
1. Indicators don’t predict
Key facts today
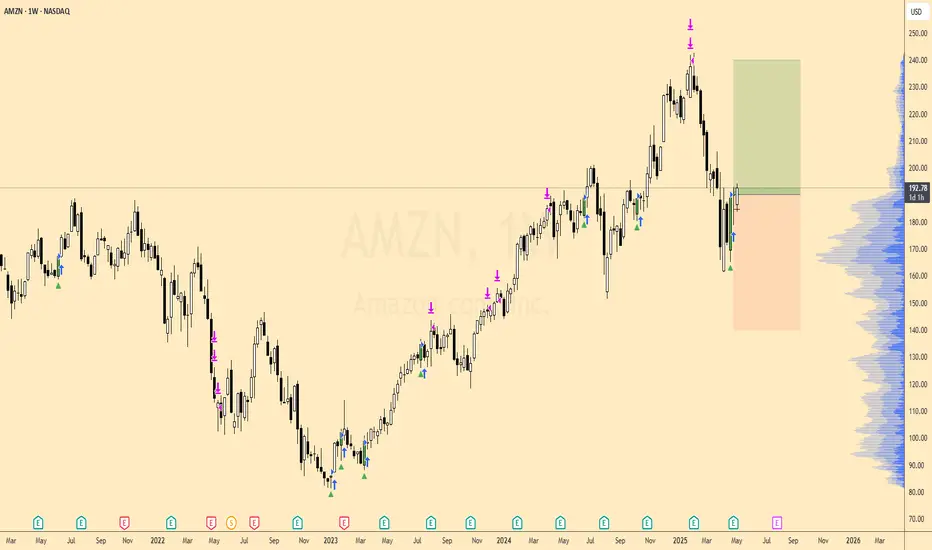
About Amazon.com
Amazon.com, Inc. engages in the provision of online retail shopping services. It operates through the following business segments: North America, International, and Amazon Web Services (AWS). The North America segment includes retail sales of consumer products and subscriptions through North America-focused websites such as amazon.com and amazon.ca. The International segment offers retail sales of consumer products and subscriptions through internationally-focused websites. The Amazon Web Services segment involves in the global sales of compute, storage, database, and AWS service offerings for start-ups, enterprises, government agencies, and academic institutions. The company was founded by Jeffrey P. Bezos in July 1994 and is headquartered in Seattle, WA.

Amazon (AMZN) shares jump more than 7%Amazon (AMZN) shares jump more than 7%
As shown in the Amazon (AMZN) share chart, the price surged by over 7% yesterday, breaking above the key psychological level of $200 and closing at its highest point since early March.
The sharp rise in demand was driven by reports of a trade truce between t

AMZN Weekly Bullish Setup - 91% Historical Win RateI’m looking to go long on Amazon (AMZN) on the weekly chart as the price that has acted this way has been a strong indicator for a swing trade in the past.
Since early 2023, AMZN has climbed from the mid-$70s to a peak above $245, carving out clear impulse moves followed by healthy pullbacks.
Th
How to Trade with Professional TradersThe most important professional side group you need to learn to trad with are the professional traders. Many work for the Sell Side Institutions on huge trading floors or from their home office. Some work for the Buy Side Institutions and trade for the Giant Pension funds companies, Mutual funds com

Pull Back is RequiredAMZN Sell Setup - GETTEX:AMZ
Bearish Momentum on Daily Chart
Instrument: AMZN
Timeframe: Daily
Direction: Sell
Confidence: 75%
Setup Overview:
AMZN is showing bearish signals after a recent pullback. MACD has a bearish crossover, and RSI is overbought at 61.25, indicating potential fo

Amazon - Look At This All Time High Retest!Amazon ( NASDAQ:AMZN ) will create the bottom soon:
Click chart above to see the detailed analysis👆🏻
The trend on Amazon is clearly towards the upside and the recent correction of about -30% did not change that at all. Rather, we are now witnessing an extremely bullish all time high break and

AMZN trading at 20 year trough forward EV/EBITDA multiplesAMZN is trading at 20 year trough forward EV/EBITDA multiples. Right now that is 10.3x forward EV/EBITDA. For reference, the 20 year average multiple is 18.23. Note the standard deviation lines on the multiple chart on the bottom right indicate that AMZN is trading nearly 2 sigma below the 20 year a

AMZN at a Decision Point – Compression Before the Pop?Let me walk you through what I’m seeing on AMZN right now — because this thing has been quietly setting up, and I’ve got my eyes locked on a few key levels.
🧠 My Current Read on the Chart
From the daily timeframe, AMZN has clearly been in a falling channel since the Feb highs, but recently it’s bee

WHAT A LOVELY BULLISSH GAP ON AMAZON: A 4RR PROFIT TRADE CLOSEDI just closed this beautiful 4RR trade on Amazon.
The trade was entered last week, this new week market open Gap pushed the price high to my 4RR target.
Trade Idea;
The monthly is extremely bullish.
The weekly is also bullish.
Daily is bullish as well, so i entered on the daily time frame pull

AMZN watch $186-189: Key Resistance zone for Recovery BounceAMZN struggling with China tariffs but trying to recover.
Now up into a key resistance zone at $186.75-188.98
Anticipating some consolidation below or within zone.
.
Previous analysis that called the TOP:
===================================================

See all ideas
Displays a symbol's price movements over previous years to identify recurring trends.
Curated watchlists where AMZN is featured.


