AU200 trade ideas


R.I.P Australian Economy. - ASX forming evening star on daily.Can the governments prevent the asx from falling? that is the real question.
Bears are in control.
Crash 2.0 incoming, unless they fire up the money printers.
REFER TO WALL STREET CHEAT SHEET

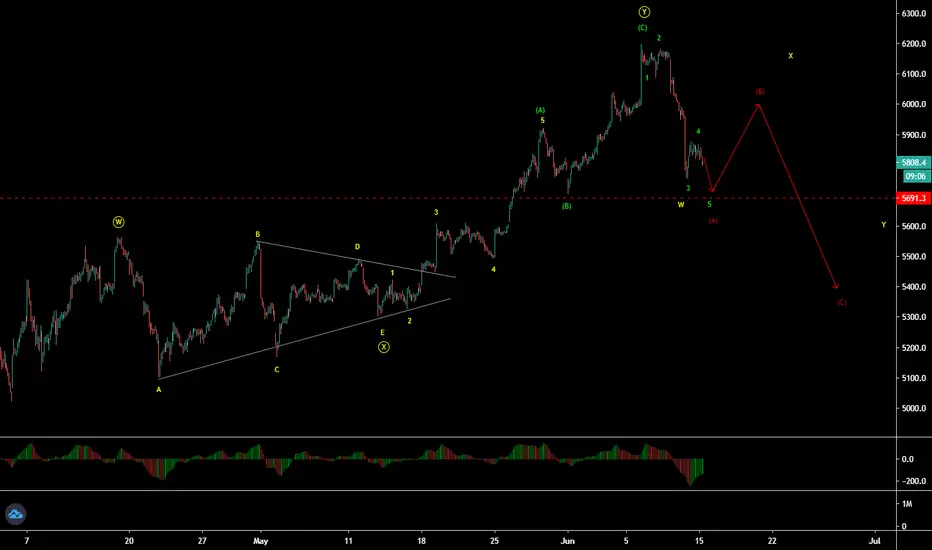
XJO - Updated EW count XJO is in 5th wave of down cycle. It has completed WXY corrective up cycle from major bottom in 2 hr time frame. The drop from last swing high in 30 min time frame is impulse and within its 5th wave. In futures of XJO it dropped in A impulse wave down, which is not still confirmed in XJO Index. Wait for little more price action, which decides the next correction. In futures it made new low and getting divergence in indicator too. Will see how it moves in Index now.
AUS200 Long Baby!Area of confluence on 4hr D and W tf. Look for the setup at 9-12 utc+10 tmrw.15m chart

AUS200 buy limit pendingThe image explains it. AUS economy making a strong recovery, RBA maintaining economic conditions and will be responsive going forward. Not currently seeing AUD strength as an issue.


AUS200 retraceafter a long awaited breakdown in bullish pressure, expect more downside as negative sentiment clouds the market


XJO end of 13/06/2020. Opening green next weekFinally, a pullback we've been waiting for.
XJO was running way too fast and pullbacks are healthy in the long term. The pullback came right at the 0.618 FIB level.
Tested the 200MA and will be interesting to see if we hold the 200MA next week.
RSI is still relatively overbought but as the pullback was so sharp, I expect a green day on 16/06/2020 Monday.
Apart from the technicals, other reasons for the pullback include
1. Fears of 2nd wave
2. End of financial year profit-taking
3. Federal reserve grim outlook
4. Riots
Next week will be a decisive week in determining which direction the market is headed. The overall sentiment is optimistic but the market does not care.
Next bullish target is 6380 level.
All the best if you went Long on Friday on short-medium term positions.

My Bearish view of ASX200 and When to enter for the Long Term.For those that use the "Fib Speed Resistance Fan", our XJO hit 0.25 and retraced.
Could we retrace back to the 0.382 in the coming days/weeks?
Also, I wish I have found this earlier!! This has correctly forecasted the support line during the March lows.
Furthermore, a good entry point for investing in the long term is when the " William R" is below the yellow and is rising from the bottom.
The last three times this has picked the bottom!
I will be watching these indicators at the next sell-off.

ASX 200After smashing through resistance and the key 6000 level a few days ago, XJO touched the long term upward sloping trend line beginning March 2009, before quickly falling back below 6000 and back below support and subsequently bouncinb off 0.218 fib level
Few key levels to watch but prefer a downside bias here.


XJO ASX 200 - Taking a breather at 6000 XJO ASX 200 - Taking a breather at 6000 -
Top of trend channel
Rejecting 200 SMA
Hitting 61.8 Fib retracement level
Indicators looking to start turning down towards cycle low


The trend is your friend, Go Long until this breaks $XJO ASX200The trend is your friend,
Our stock market dropped because we hit the top of this regression channel again.
Yesterday, I said I am expecting a pullback back to 5700-5800. It happened.
I am staying bullish until this channel fails.

Trendline breaks on XJOPre-open XJO (12/6/2020). Trend lines in price and RSI (x2) broken yesterday. Not necessarily confirmed as we need to see structure and/or continuation below to know for sure, but if you're heavy in equities you might want to watch this closely..

S&P 200 could complete the last leg up next week at 6030S&P 200 appears to be in a corrective ABC pattern. It has completed Waves A and B is currently moving upwards in Wave C. It has also completed four waves of Wave C and could move up next week to complete the fifth of the C wave around 6030.
Calculation of the target
Wave (v) could be equal in length to wave (i) or Wave C could be 0.613 times the length of Wave A. Interestingly, in both cases, the target is around 6030.
PS: This analysis is just for educational purposes and is not a recommendation to buy or sell. Please do your own research and trade at your own risk.


AU200 Short Trade Setup! Welcome to Profitlio Trading!
What's up traders! Thanks for Jumping back on my Analysis, 👨💻 Trader champ is here on your Service, Also hit thumbs up 👍 and support the work
AU200 showing a trend breakout which is a good sign for AUD pairs to crush. Expecting a nice sell on this index. Sketch up your own trade setup and make sure you meet with the required confirmations first before you make your move!
⭕️ ✅ Scroll Down 👇 ⬇️ to signature section for 📲 contact details 💰💰💰
Profitlio Trading ( Since 2014 in Financial Markets )
________________________________________________
Traders Disclaimer: Non of our analysis or trade setups being shared here on trading view is a trading advice. As we keep on weekly updates with our predictions and expectations. We may take them as a trade only if trade setup meets the required criteria ( Confirmations ). Unless we will never take them as a trade if it never reach our trading requirements.
Take them at your own risk as trading is highly risky and you may loss your investments. Our trades are based on Swinging and Mid to long term approaches. All trades executed will be handled under the name of Profitlio Trading only.

Risk Management - TD Red 9 (Sell Signal) 2 Day Chart ASX200 $XJOThe TD Sequential indicator is showing a red TD 9 (Sell Signal) and the RSI is showing the market is overbought and is due for a pullback.
This is a healthy pullback, as long as ASX200 can stay above 5700 (5800* even better), I am expecting ASX200 to break out and keep going higher 6200+.

Just a pullback? Or something moreQuick look at the ASX200 during the first red day in the last seven trading days... Price now seems to be at an area of importance on the 1hr which formed a small range the last time it was here, if it breaks 5945 easily then it could go into free fall. There is also a massive Morning Doji Star reversal pattern on the Daily and the problems in the economy and world in general are not improving as much as the market would suggest. Although i've taken profit on a short today and will be looking for another entry depending how today closes. I got burnt badly with this sort of trade the other week, but i'll follow what my technicals tell me as that's the only way to improve.
