Alibaba - This Chart Speaks In Money!Alibaba ( NYSE:BABA ) prepares for a significant pump:
Click chart above to see the detailed analysis👆🏻
Basically since Alibaba was listed on the NYSE, it always perfectly respected market structure. With the recent rejection away from the key neckline, Alibaba is now creating a bullish break and retest. After bullish confirmation, this forms a bottom and we might see new all time highs.
Levels to watch: $110, $140
Keep your long term vision,
Philip (BasicTrading)
BABA trade ideas

Alibaba - Don't Forget Chinese Stocks Now!Alibaba ( NYSE:BABA ) still remains super interesting:
Click chart above to see the detailed analysis👆🏻
After we saw the very expected parabolic rally on Alibaba about four months ago, Alibaba is now perfectly retesting major previous structure. Yes, we could see a short term pullback in the near future but this just offers a perfect break and retest after the rounding bottom pattern.
Levels to watch: $110, $140
Keep your long term vision,
Philip (BasicTrading)

BABA bulls lose control!my last bullish analysis was late February 2024, It can all bullish targets. now it seems like bears are taking over again, I think we may see the dip continue to trend support/support zones.
we may see a cluster support bounce around 78-89 area, Boost and follow for more

$BABA slingshot ++ china long previsous bullish divergence ;
new scenario
Uptick in volume , slinght shot RSI & MACD oversold ,
China & Trump deal is inevitable china needs a plan but Trump keeps poking , you know you have the upper hand just wait a while ++ pushed back the TikTok deal so you have an extra 75 days with that you know they need some time as China was clearly unprepared ;;;;
anyways, I'm bullish and this goes for NASDAQ:JD NASDAQ:BILI aswell .

BABA is going down Hard BABA has dropped on a violent gap making a very large window with no bounce in sight. The drop should be very fast

BABA to hit 100 today in the ADR US listingChinese stocks are plunging, Hang Seng -13%. Alibaba will be hit by the trade tarrifs.

BABA ending a very clean Wyckoff Acumulation schematic here?As the title says. Appears to be a very clean accumulation schematic. Currently in the SOS area. Consolidation could continue for months here. Timing is hard, let's see what happens over the next weeks and months.


Triple TopWe are testing this weekly to the 3rd time now.
For almost 1 month we cannot overcomethis top level. Supposedly Ali Baba has forgotten the passwort to escape the cave and the treasure is overbought.

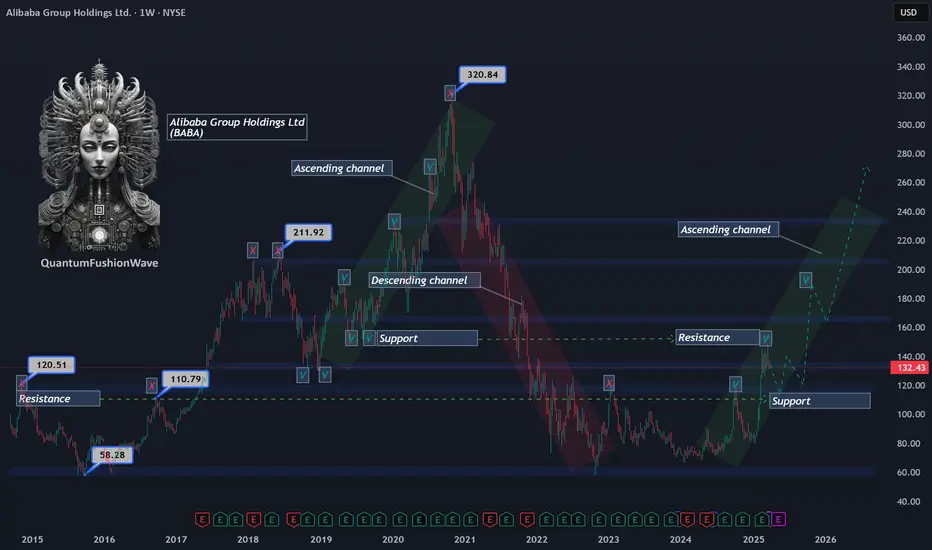
Alibaba (BABA) Technical Analysis:Retracement Within an Ascending Channel
Alibaba (BABA) has faced strong supply pressure at $149, a key price level that previously acted as support in 2019 and has now flipped into resistance. The inability to reclaim this level has triggered a retracement, with the stock currently trading around $132, showing signs of continued corrective movement.
Despite the short-term weakness, BABA remains within a developing ascending channel, suggesting a potential higher timeframe bullish structure. If the retracement extends, the next significant level to watch is $110, a historical 2016 resistance level that could now act as a demand zone. A strong reaction and rejection from this level would reinforce the validity of the ascending channel and increase the probability of a trend continuation toward previous all-time highs.
Key Levels to Watch:
Resistance: $149 (2019 support turned resistance)
Current Price: $132 (active retracement zone)
Support Levels:
$110 – Historical resistance from 2016, potential demand zone
$100 – Psychological level, further downside risk
Traders should monitor price action around these key levels, as a confirmed breakdown below $110 could invalidate the channel and shift market structure to a more bearish outlook, while a strong bounce could provide a high-probability long setup within the channel’s framework.
$BABA - Bearish divergenceNYSE:BABA looks like it could check back to $120 area. Bearish divergence on both MACD and RSI.👀
Beginning of the Uptrend for Stock #01Beginning of the Uptrend for Stock #01: 9988 (BABA)
The price has broken out of a consolidation range that lasted approximately two years, supported by a normal volume distribution.
The stock has risen to meet the Fibonacci Extension resistance level of 161.8 at a price of 144 HKD. Currently, it is forming a sideways consolidation pattern on the smaller timeframe, establishing a base structure viewed as re-accumulation.
The 6-month target is set at the Fibonacci Extension level of 261.8, which corresponds to a price of 189 HKD. This target aligns with a price cluster based on the valuation from sensitivity analysis, using the forward EPS estimates for 2025-2026 as a key variable for calculations, along with the standard deviation of the price-to-earnings ratio.
Wait for the Right Moment to Accumulate Shares within the Consolidation Range
Purchase near the support level of the range when the price pulls back. Look for a candlestick reversal pattern as a signal to add to your position.
However, should the price break down to the lower consolidation range, the stock would lose its upward momentum, potentially leading to a prolonged period of consolidation or a deeper pullback to around 90 HKD.
Always have a plan and prioritize risk management.

$BABA HARMONICS Suggest move is over with a possible $95 TargetNot sure if I'm doing this correctly but please do chime in and help out if you can. What this is, is an addition to my previous post about BABA coming back down to EARTH. I'm just adding another chart to reinforce the idea.

$BABA on its way to $120s into AprilI would honestly be surprised if it doesnt gap down this Monday before the open. The weekly imo, looks like a mess atm and could gap into $120s easy. If it doesn't, I would expect some consolidation for a fall into the First week of April. We're right at the golden pocket retrace at the .618, very common retracement level, if we look at Fibs with a bearish perspective and measure a retrace back to the lower golden pocket at 1.61 fib from highs, $112.30 would be my ultimate target if we can break $126. $126 opens the flood gates to our ultimate target at $112.

BABA TO CONTINUE MARKING UPTypical Re-Accumation of Schematic #2
As volume depleted,
1/ Feather's weight with SpringBoard in action (Red Line)
2/ Trigger Bar ** red arrow today with huge vol influx
in the background of Uptrend, position initiated as attached
Pure Wyckoff

Alibaba (BABA) Share Price Declines from 40-Month HighAlibaba (BABA) Share Price Declines from 40-Month High
As shown in the Alibaba (BABA) share chart, the price reached a 40-month high this week, surpassing $145 per share.
Bullish sentiment is being fuelled by news related to AI prospects in China. According to media reports:
→ China’s AI spending is increasing through investments from state-owned enterprises, private companies, and local authorities, aiming to keep pace with the US $500 billion Star Gate project.
→ Alibaba plans to invest $52 billion over three years in artificial intelligence and cloud computing.
Technical Analysis of Alibaba (BABA) Shares
Despite a positive fundamental backdrop, the chart signals potential concerns:
→ The price is near the upper boundary of the ascending channel, which could act as resistance.
→ Bulls attempted to break the $145 level (which has acted as resistance since late February) on 17 March but failed, as the price could not hold above this mark.
→ Using your preferred oscillator, you are likely to observe a bearish divergence between peaks A and B.
This suggests that bullish momentum may be weakening, and investors could consider taking profits after Alibaba’s exceptionally strong price rally—up approximately 70% since early 2025. If so, a break below the orange trendline could lead to a correction towards the median of the blue channel.
This article represents the opinion of the Companies operating under the FXOpen brand only. It is not to be construed as an offer, solicitation, or recommendation with respect to products and services provided by the Companies operating under the FXOpen brand, nor is it to be considered financial advice.

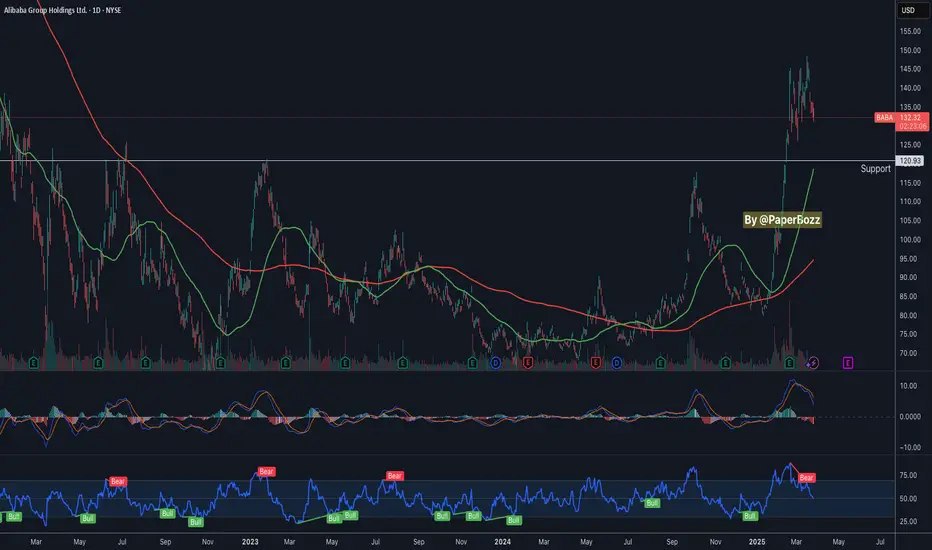
BABA Breaks Out as AI Assistant Makes Waves in ChinaAlibaba’s share price has been on a tear in 2025, surging more than 70% in the first eight weeks of the year before settling into a period of consolidation. That consolidation phase has now given way to a fresh breakout, as the stock pushed through resistance in an ascending triangle pattern.
Let’s take a look at the technical and fundamental catalysts that have aligned to make Alibaba a stock to watch this year.
The AI Catalyst
Alibaba’s latest breakout isn’t happening in a vacuum. The company’s AI assistant, Quark, has been making waves in China, drawing positive reviews and raising hopes that it could become a dominant player in the AI agent space. Powered by Alibaba’s Qwen reasoning AI model, Quark has been repositioned as an all-in-one AI assistant, incorporating online search, cloud storage, and generative AI capabilities.
The timing of this development is critical. AI is one of the biggest battlegrounds in tech, and Alibaba is making its presence felt with an open-source approach designed to spur innovation. Broker Jefferies has highlighted Alibaba’s view of AI as a vast, addressable market, and the company’s recent commitment to investing 380 billion yuan ($52 billion) in cloud computing and AI infrastructure underscores the scale of its ambitions. If Quark gains real traction, it could be a meaningful growth driver.
Bull Flag Breakout
From a price action perspective, Alibaba’s recent move is a textbook bullish breakout. After its rapid rally to start the year, the stock pulled into a consolidation phase, forming a series of higher swing lows against a horizontal resistance level. This created an ascending triangle – a classic continuation pattern that signals a potential breakout when resistance is finally breached.
Monday's price action delivered that confirmation, with Alibaba breaking and closing above the bull flag formation. This move suggests the uptrend is back in full swing, and breakout traders will be watching two key levels to ensure the bullish momentum remains intact.
The first is the former resistance level, which should now become support. A successful retest would reinforce the breakout. The second is the volume-weighted average price (VWAP) anchored to the bottom of the flag – as long as price stays above this level, the bullish structure remains in place.
Alibaba (BABA) Daily Candle Chart
Past performance is not a reliable indicator of future results
Disclaimer: This is for information and learning purposes only. The information provided does not constitute investment advice nor take into account the individual financial circumstances or objectives of any investor. Any information that may be provided relating to past performance is not a reliable indicator of future results or performance. Social media channels are not relevant for UK residents.
Spread bets and CFDs are complex instruments and come with a high risk of losing money rapidly due to leverage. 83% of retail investor accounts lose money when trading spread bets and CFDs with this provider. You should consider whether you understand how spread bets and CFDs work and whether you can afford to take the high risk of losing your money.

Alibaba Wave Analysis – 17 March 2025
- Alibaba broke the key resistance level 145.00
- Likely to rise to resistance level 155.00
Alibaba recently broke the key resistance level 145.00, which stopped the previous waves 3 and (b), as can be seen from the daily BABA chart below.
The breakout of the resistance level 145.00 accelerated the active impulse wave 5 of the intermediate impulse wave (C) from January.
Given the strong daily uptrend, Alibaba can be expected to rise to the next resistance level 155.00 (target price for the completion of the active impulse wave (C)).

Alibaba potentional scenario here close to resistanceNYSE:BABA Technical Analysis
Alibaba (BABA) is showing a strong uptrend, with bullish momentum targeting $166.44 as a key resistance level.
However, once it reaches $166.44, we may see a sharp pullback, with price retracing towards the $103 level. This area serves as a strong support zone, historically acting as a demand level.
Key Levels to Watch:
Resistance: $166.44
Support: $103

Complete InsideIf the week will end at this aproximate level we will see a complete inside bar.
I consider this as a sell signal.
I thinkthat there is no doubt that the time is ripe for a downward correction anyway.
Within 1 1/2 month only we have risen for over 80 %.

The last opportunity If you did not take the January 17th post serious when BABA was 84 dollars, you have to be brave enough to pull the trigger after a 75% move in 2 months.
But most people will sit and wait for a big correction to get involved while they don’t think in the past 4 weeks when market was correcting, BABA stayed flat and as soon as selling pressure decreased, BABA break above the resi.

Bullish Play on (BABA) Ahead of Chinese Economic Data & Alibaba (BABA) is forming a triple top pattern near the $142-$145 resistance zone ahead of key economic data releases and potential positive stimulus measures from the Chinese Congress meeting. While a triple top is traditionally seen as a bearish formation, a breakout above resistance could signal strong bullish momentum, fueled by market optimism regarding Chinese economic support and potential tariff relief.
Trade Setup: Long Position on BABA
📈 Entry Point:
Breakout confirmation above $145 (previous resistance).
If momentum is strong, consider scaling in at $143-$144 for an early entry.
🎯 Target Price:
First Target: $155 (short-term resistance from early 2023).
Second Target: $165 (next major psychological level if sentiment remains strong).
🛑 Stop-Loss:
Below $138 (recent swing low and key support zone).
Alternatively, a trailing stop-loss to secure profits as the price rises.
Catalysts Supporting a Bullish Breakout:
1️⃣ China’s Economic Stimulus 🏦
The Chinese government is expected to announce new stimulus measures to support growth, which could boost investor confidence in Alibaba and other Chinese tech stocks.
Potential fiscal easing & liquidity injections may drive funds into large-cap Chinese equities.
2️⃣ Positive Economic Data Expectations 📊
Retail Sales & Industrial Production (March 17, 2025)
Strong numbers would indicate a rebound in consumer spending & manufacturing, benefiting Alibaba’s core e-commerce business.
3️⃣ Tariff Reduction Speculations 🌎
If the Chinese Congress signals progress on easing U.S.-China tariffs, Alibaba could see increased foreign investment & improved profitability.
4️⃣ Technical Breakout Potential 🔍
The triple-top pattern could turn into a breakout if volume surges past resistance ($145).
A move above this level could trigger short-covering & FOMO buying, leading to a quick rally.
What If the Data Disappoints?
If economic data underwhelms, BABA could reject resistance and pull back toward $130-$135.
In this case, waiting for a confirmed breakout before entering long positions is advisable.
📌 Final Thought:
BABA is at a critical inflection point. If economic optimism and stimulus expectations materialize, a breakout past $145 could fuel a strong rally toward $155-$165. Traders should watch for volume confirmation and be prepared to ride the upside while managing risk carefully. 🚀💹
Check out my other ideas about chineese stocks and more:

Baba Price is overbought on the monthly and weekly money flow and RSI..
This current rang trade is likely distribution
Also we are 30% extended from the 50 SMA . This is extreme
I would buy this at all up here , I think we will retest 104-108 (Weekly200ma) on a pullback before we break over 150.
I don't know when this distribution breaks and price resets but until then you can just trade the range 145-130...
Id take a short at 145-150 a few months out . .stop loss over 150.
Below I will show you a perfect example of price being extended and over bought at resistance and distributing..
This is AVGO.
Notice how it tagged it's trendline (Red arrow.
Now at that point the technicals were pretty overbought similar to where baba is now
Now zoom in here and notice price traded in what looked like a bullish pennant here at resistance
But look how it panned out
It was never a pennant, it was distribution in disguise..
every now and then you get a meme type of movement like PLTR or Mstr where technicals are thrown to the window but I don't think this is it
