BAC - Touch and Go from 43BAC Hit previous projected target at 43.
Breaks and Retest 43 - This level is now become Resistance Turned Support level.
Slow Turtle with ATOM buy triggered after exceptional earning.
FiFT spike
Banker % increase gradually and now has exceeded 50%
Next Target 47, 50 and 53
BAC trade ideas

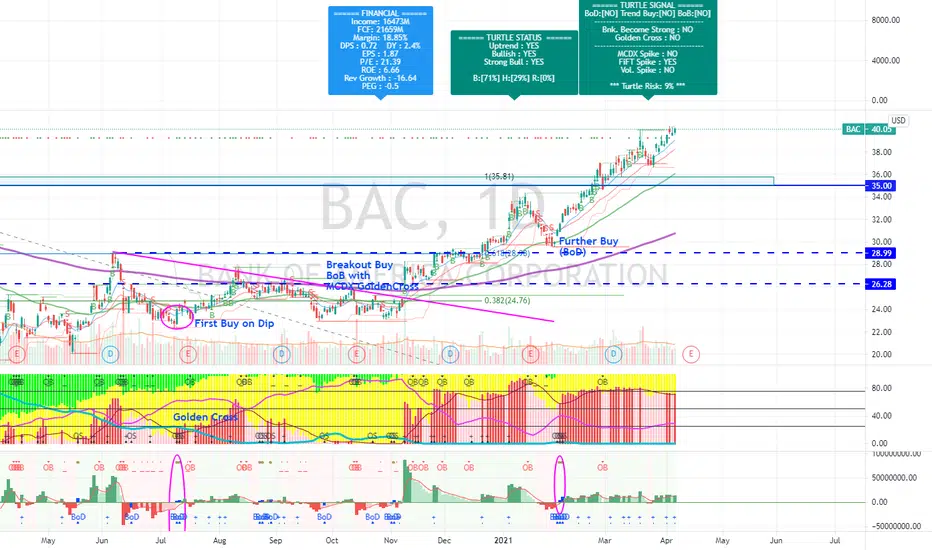
BAC - Next target 43 ? Completed rounding bottom at 35 and breakout.
Next target 43, 46, 54
60%++ since BoD
Bullish, Uptrend and Strong
Banker's Volume 71%. Retailer's Volume 0%
Next earning : 15 April
$BAC Bank Of America $49 PT
Hopefully you find the chart helpful in terms of Supports & Resistance etc.
we refrain from adding commentary on the chart as that is reserved for our members and we are very conscious of not giving financial or trading advice.
Thank you for taking time to consult our chart and we would really appreciate a like, follow or comment.


Elliott Wave View: Bank of America (BAC) Correction Should Find Short Term view in Bank of America (BAC) suggests the rally from July 19, 2021 low is in progress as a 5 waves impulse Elliott Wave structure. Up from July 19 low, wave (1) ended at 42.84 and pullback in wave (2) ended at 38.36. The stock has resumed higher in wave (3) with internal subdivision as another impulse in lesser degree. Up from wave (2), wave ((i)) ended at 39.80 and dips in wave ((ii)) ended at 38.94. Wave ((iii)) ended at 44.04, pullback in wave ((iv)) ended at 41.80, and final leg higher wave ((v)) ended at 44.87. This completed wave 1 of (3) in higher degree. Wave 2 pullback is now in progress to correct cycle from September 21 low before the rally resumes.
Structure of wave 2 pullback is unfolding as a double three Elliott Wave structure. Down from wave 1, wave (w) ended at 43.27, wave (x) ended at 44, and wave (y) ended at 42.33. This completes wave ((w)) in higher degree. Expect wave ((x)) rally to fail for another 3 waves lower to end wave ((y)) of 2 before the stock turns higher again. Near term, as far as September 21 low pivot at 38.34 stays intact, expect dips to find support in 3, 7, or 11 swing for further upside.

BAC weekly chart possible bull trap formationAlong with other bearish signals on large banks, BAC has a really strong looking bear setup. If the bulls can take these levels, then this will heavily tilt the bias to the other side - but if the bears take these levels, you're probably also going to be seeing some headlines in your favourite media outlets. Something dramatic may be approaching.

Short Position Bac PT 39Rising Wedge in the Hourly and Daily Charts. This is just my honest opinion thanks :)

2022 will not be a good year for Bank of AmericaI know nothing about this bank, I have never traded this stock, and I have never used their products. The recent outages this weekend that made headlines made me curious enough to look at the graph.
That being said...
MACD is not only declining, but it's also back to where it was before the IT bubble popped in the late 90's. It has simply gained way too much in too short of a time frame.
I suspect it's going to print a head and shoulders pattern. And if it does, I see a much larger breakdown in the following years and return to 2015 levels again.

Bank of America & JP Morgan 100% identical pattern!Both are struggling at the resistance level!
Weekly charts:

BAC struggling at 1997 resistance I have 2 things outlined in this chart.
1. Horizontal resistance (Purple line) dating back to 1997 at 44.22
2. 3yr long Bearish rising wedge (Yellow line)
Currently BAC is knocking at the door of both resistance. A rejection Here and a fall out outside the wedge could send BAC back to 33$

BAC: Ascending triangle (46%)Bank of america showing some possible move up.
Ascending Triangle, not confirmed yet.
Must break through the 43$ resistance (with volume) to confirm.
If confirmed:
Price target = 63.56$
Stay humble, have fun, make money!

Bank of America Bearish. BACPost Ascending triangle, and B wave of Zigzag. Quite a clear picture here and plenty of time to complete the zigzag. It's correcting now post most recent overbought state as well.
We are not in the business of getting every prediction right, no one ever does and that is not the aim of the game. The Fibonacci targets going down are highlighted in purple with invalidation in red. Fibonacci goals, it is prudent to suggest, are nothing more than mere fractally evident and therefore statistically likely levels that the market will go to. Having said that, the market will always do what it wants and always has a mind of its own. Therefore, none of this is financial advice, so do your own research and rely only on your own analysis. Trading is a true one man sport. Good luck out there and stay safe!


Long BAC based on the tapering expectationUS 10 Year bond yield is still low... It's still a good time to buy!

BAC Daily TimeframeSNIPER STRATEGY (new version)
It works ALMOST ON ANY CHART.
It produces Weak, Medium and Strong signals based on consisting elements.
NOT ALL TARGETS CAN BE ACHIEVED, let's make that clear.
TARGETS OR ENTRY PRICES ARE STRONG SUPPORT AND RESISTANCE LEVELS.
ENTRY PRICE BLACK COLOR
TARGETS GREEN COLOR
STOP LOSS RED COLOR
DO NOT USE THIS STROTEGY FOR LEVERAGED TRADING.
It will not give you the whole wave like any other strategy out there but it will give you a huge part of the wave.
The BEST TIMEFRAMES for this strategy are Daily, Weekly and Monthly however it can work on any timeframe.
Consider those points and you will have a huge advantage in the market.
There is a lot more about this strategy.
It can predict possible target and also give you almost exact buy or sell time on the spot.
I am developing it even more so stay tuned and start to follow me for more signals and forecasts.
START BELIEVING AND GOOD LUCK
HADIMOZAYAN

BANK OF AMERICA Daily TimeframeSNIPER STRATEGY
This magical strategy works like a clock on almost any charts
Although I have to say it can’t predict pullbacks, so I do not suggest this strategy for leverage trading.
It will not give you the whole wave like any other strategy out there but it will give you huge part of the wave.
The best timeframe for this strategy is Daily, Weekly and Monthly however it can work any timeframe above three minutes.
Start believing in this strategy because it will reward believers with huge profit.
There is a lot more about this strategy.
It can predict and also it can give you almost exact buy or sell time on the spot.
I am developing it even more so stay tuned and start to follow me for more signals and forecasts.

BACEasier to see this set up on a line Chart
Wait for break of key Daily Level before entering.
MACD suggest more selling to come.
With Sept being a bad month Traditionally for stock BAC should follow this trend.

BAC .... please post any comments about future movements Bank of America trade ready .... but which direction is the next trade?
post your comments

Swing trade for BACtos picked up this ascending wedge pattern. Took a closer looking, it did break trendline
There was a double top price rejection at the 200 sma on this chart. Target price is under $40. Swing trade, bearish.

BAC: M-top pattern?M-top pattern (double top) might signal some downside price potential.
Below 42.50 supports a bearish trend direction.
MACD bearish crossover also supports a change in trend direction.
RSI leaves enough room for further downside price potential.

$BAC Range Manage risk and always be aware that movements in the overall market can effect stocks in all sectors.

Possible Inverse Head and Shoulders setup on $BACoriginal pt was 42 but looks like we could bounce in a falling wedge pattern and breakout of resistance in an inverse head and shoulders pattern, I think if you aren't already in it is worth putting an alert on for the break out as well as the potential bounce here

Trade Review: How I Traded $BIDU + SET UPS RECAP!! & How I am coIn this video I will reviewing trades I took on August 26, 2021 going full in depth explaining how I traded $BIDU for a nice 20% Day trade with the full breakdown Inside Day, as well explaining my swings I took on the banks and my reasoning behind it .As well the Breakdown trade I posted on twitter and how they worked out and the result of them Traded tickers with a new strategy I been testing with Inside Candles Credit: TW for his indicator and his strategy! Going in Full in depth with my entry, Exit thought process and how I analyze my Nasdaq chart Traded these tickers using my knowledge of technical Analysis , sharing my levels: Support & Resistance , my trendlines , Fibs, Waves, Price Action, Channels , Emma's, and prior experienced , while providing both bullish & bearish scenarios for you to be able to understand my analysis and wait for confirmation as always!
Want to see more content like this? Make sure to Like and Subscribe!
