BAC trade ideas

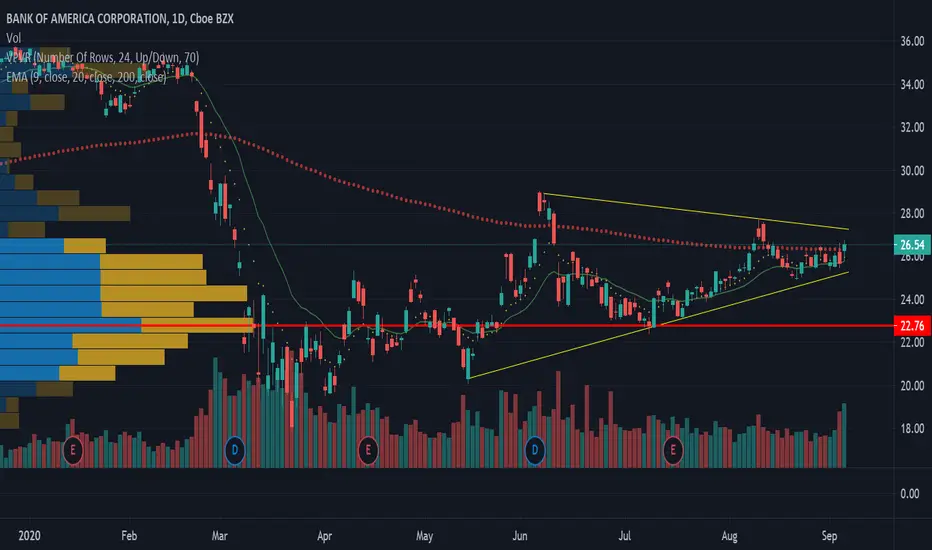
BAC RETEST 28 BULLISHBAC is on a strong ladder pattern upward, bull run can be confirmed looking at RSI.
Possible Next stop 28 and depending on market reaction, a retest of upper resistance.

BAC - Long, Target $27.50 and $29.00 in the next 2 weeksBAC is forming Cup and Handle on D1 chart.
Now is $26.50. with this pattern BAC's target are: $27.50 and $29.00.
While the market in the correction process.
The cash flow from other Sectors that are Overbought is certainly looking for a new destination.
Banking is a good Sectors that is regaining balance when it exits the Oversold zone and keep going up slowly.
I predict BAC will hit 2 targets in the next 2 weeks, with 70% confidence level, 10% Sideway and 20% drop to $25.50 - $26.00.
Ichimoku, RSI, MACD are supporting this uptrend too.
Disclaimer!

BAC Cup & Handle Inside of a wedge patternBAC Cup & Handle inside of a wedge pattern looks good for a breakout through 27 level. With Tech selling off last week and Banks showing strength Im looking for this lagging sector to finally get some love. After the big day Friday some consolidation would be nice to give a tighter entry but we may not get it.

BAC Breakout planBAC has a very nice wedge set up under the 200 EMA, I am looking to go long if the 200 EMA is broken with my first Price Target of 28.74, 30.26 and then 31.68.

BAC Bank of America will stay between upper trendline and gannThe 1/3rd gann line is acting as a strong support aswell as the 0.382 fib level that created a triple bot. The price will pull back to 0.382 level to the short term fib level which lines up perfectly with the 1/3rd gann support line and from there it will continue its way up to $27.07 price target which is the trend line and which is also 1.272 fib level before pulling back again to $26.72 retesting previous highs

BAC - Bank of America Based only on technical analysis, the idea is to go long as the resistance level of 26.5 USD has been broken many times.
To be on the safe side, as there are not a lot of signal the best option could be still to HOLD.

BAC with Ascending triangle, possible breakout in banksHappy Labour day weekend traders! Looking at banks here, BAC and JPM with Ascending triangles, possible breakout in banks. A test of the 200 SMA would be 27.28. Recent option flow, 3200 Nov $28 calls for BAC. JPM - over 5000 for Nov $110 calls. I will post some more charts later. Enjoy!

Bank of American (BAC) Three Rising Valleys Bullish SignalNYSE:BAC is undergoing a 3 rising valleys pattern which is very bullish when you combine it with divergence on both oscillators. The tech sector seems to be bleeding and investors might shift their cash into financials such as BAC.
Targets are also provided if one was to take part in it. Very good R/R ratio so stop loss could be set a litter looser.
This is not financial advice and it is only meant for education. I am not responsible for any loss you have from trading my ideas including this one.

BAC may be heading for its quarterly LOWBAC may be heading for its quarterly LOW.
the price action and relative strength + volume suggests that this may happen... NYSE:BAC


BAC daytrade idea on the up to $26 - $26.50 before Sep 3thM15 and H1 timeframes give clear bullish signals on Heikin Ashi candles.
M15 is trending up to tear the EMA ribbon silk.
MACD on H1 is showing a cross below zero line.
At the same time, CCI and RSI are showing bullish signal too.
Disclaimer!

$BAC - lining upThis is starting to shape up as a nice place to make some $$ on an option.
Watching during the day 9/2 for position or signal. Could need til friday to firm up decision


BOA - Bank Of America Never been a big fan of Bank Stocks, but with much of the market recovering, banks still have room to head back to their 1q price levels. We also have the election on the horizon which leads to uncertainty and big money/smart money loves certainty. With the Fed printing and borrowing rates at historic levels, a dividend paying bank stock like $BOA fits that criteria for the smart safe (boring) money.
At the moment BAC is consolidating and we're waiting for a break to see which way this stock will move. It appears there is still a good amount of time before it breaks but it's another one we'll keep our eye on. If it breaks in either direction, we'll wait for the price to retouch the purple lines on our chart confirming resistance or support (depending on which way it breaks), before entering a position. We know Buffet (through Berkshire Hathaway) just bought another 34 million shares in July and BOA is still paying a 2.8% dividend with room to grow.
Our Targets:
If we get a break to the upside, we're aiming at $32-34 range. A break to the downside, looking at $22.00 area for support. Once again, we're waiting for a break and then retest before taking a position on this one.
Feel free to give us a follow and shoot us a like for more analysis updates.
Cheers!
Disclaimer:
I do not provide personal investment advice and I am not a qualified licensed investment advisor. I am an amateur investor.
All information found here, including any ideas, opinions, views, predictions, forecasts, commentaries, suggestions, or stock picks, expressed or implied herein, are for informational, entertainment or educational purposes only and should not be construed as personal investment advice. While the information provided is believed to be accurate, it may include errors or inaccuracies. I will not and cannot be held liable for any actions you take as a result of anything you read here.
Conduct your own due diligence, or consult a licensed financial advisor or broker before making any and all investment decisions. Any investments, trades, speculations, or decisions made on the basis of any information found on here, expressed or implied herein, are committed at your own risk, financial or otherwise.
Feel free to give us a follow and shoot us a like for more analysis updates.


up or down also can range side way chart
FiFt show BoD
candle almost touch EMA 200
good signal for up ( if break trend line )
EP 26.30
SL 24
1 TP 27
2 TP 29


BAC 1D BEAR FLAGBear Flags are Ranges which are repeatable trading chart patterns.
Bear Flag chart patterns will have a directional bias depending on the previous incoming trend.
Each chart pattern will have defining trendlines of the support/resistance levels creating the pattern.
Whatever time frame you are trading this chart pattern, wait for a candle close outside of the trendline in the direction of the breakout candle. (Our time frame preference is the Daily chart).
Add volume indicator - Volume is the amount of $ that went into a particular candle or in Forex the # of trades that took place.
Add ATR indicator - Volatility is the amount of price movement that occurred. Use the ATR to measure the price movement.
When you see descending Volume bars and descending ATR line (which indicates volatility) this shows
a dis-interest in traders to invest in this pair creating consolidation which creates the chart pattern.
Trade Management after there is a breakout candle close.
1 - Position size (compare volume bar to volume ma line).
a - Breakout candle must be 100% of average volume for a full position size.
b - If 75% of average volume then ½ position size. (To find 75% of Volume
look at the charts volume settings – divide smaller # into larger # = 75%+)
2 - Enter two trades.
3 - SL for both trades will be 1.5 x ATR.
4 - 1st trade TP will be 1 x ATR.
5 - No TP on 2nd trade – letting profit run and adjusting SL to follow price.
6 - When 1st TP hit – move 2nd trade SL to breakeven.
7 - Adjust the 2nd trade SL to follow price.
*8 – After Breakout candle – if price closes back into chart pattern close trade
*9 - When breakout candle is more than 1 ATR from breakout candle open.
a - Enter 1st trade at candle close with ½ position size.
b - Enter 2nd trade with a pending limit order that is 1 ATR of breakout candle open.
c – Price should pullback to that pending limit order for 2nd trade.
d – If Price returns back into chart pattern close trade before SL is hit.

