Boyd Gaming Stock Quote | Chart & Forecast SummaryKey Indicators On Trade Set Up In General
1. Push Set Up
2. Range Set up
3. Break & Retest Set Up
Notes On Session
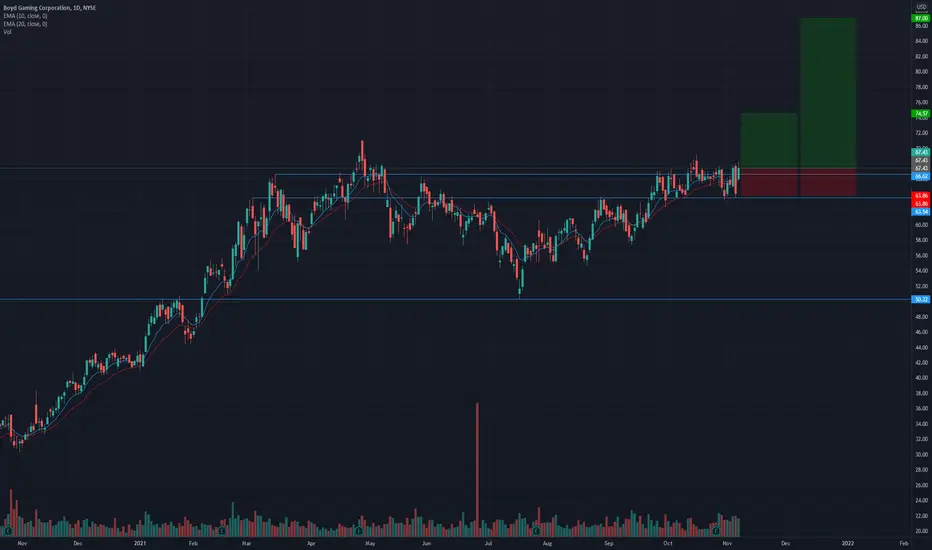
# Boyd Gaming Stock Quote
- Double Formation
* (Neckline) | Survey Valid | Subdivision 1
* 50.00 USD | A+ Set Up Area
- Triple Formation
* Retracement | 0.382)) | Subdivision 2
* Trend

Boyd Gaming Corporation | Chart & Forecast SummaryKey Indicators on Trade Set Up in General
1. Push Set Up
2. Range Set up
3. Break & Retest Set Up
Active Sessions on Relevant Range & Elemented Probabilities;
London(Upwards) - NYC(Downwards)
Conclusion | Trade Plan Execution & Risk Management On Demand;
Overall Consensus | Buy

BYD - 3,5 years HEAD & SHOULDERS CONTINUATION══════════════════════════════
Since 2014, my markets approach is to spot
trading opportunities based solely on the
development of
CLASSICAL CHART PATTERNS
🤝Let’s learn and grow together 🤝
══════════════════════════════
Hello Traders ✌
After a careful consideration I came to the conclusion that:
-

BYD Shares Down 15% as it Faces Earnings Test The Chinese biggest EV maker broke with its usual practice of not providing guidance ahead of its earnings report due later Monday. This month, the stock’s volatility jumped to the highest since October 2022, indicating increased investor demand for downside protection.
Last year, new competitors r

BYD body gaming corporation has lost all POCYearly trend up was broken with BOS
Last half year trend going down with LH/LL
Current stage R 61 and S 52. Break and confirmation of any will lead to further move down either up.
Volume concentration with POC far away at 67. Yearly Volume control lost.
Two year volume control lost.

BYD Long Position - Upward ChannelBYD has been trading in a regular upward channel for several months. It recently tapped the lower support trend and has begun to climb again.

BYD Price to move higher towrds weekly resistance and trendlinePrice heading towards the weekly resistance as well as the upwards trend line.

BYD is looking ready to move higher!* Great earnings
* Strong up trend
* High relative strength in the Consumer Cyclical sector
* Recently broke above a multi-year base at $50.32
* Has been basing ~8 months
* Forming a tight consolidation at the right side of the base
* Breaking out with higher than average volume
* Maximum probable R
BYD which direction?I like how this is playing out.
Inside an ascending channel.
From here, if the support holds (rectangle area) we might see another leg to the upside to test top of the channel.
If the support doesnt hold, we have the bottom of the trendline as support, if that fails, we see downside.
Watching it

<TradeVSA> BYD - Reversal with PullbackSign of Strength in the chart:
1. Reversal back to 20/40ma
2. Pullback with NS signal
3. Triple NS in the chart
Disclaimer
This information only serves as reference information and does not constitute a buy or sell call. Conduct your own research and assessment before deciding to buy or sell any s

See all ideas
Displays a symbol's price movements over previous years to identify recurring trends.


