CCJ Gets Another Bounce from Key Demand ZoneCameco has bounced from the key demand zone at 32.50–35.50 for the sixth time, further confirming this area as a significant support level. The 200-day moving average also played a major role in the bounce, acting as a magnet. In the last three instances, when the price moved nearly 20% below the 20
Key facts today

CCJ eyes on $45.37: semi-major Fib may dip to $42 for long entryCCJ trying to recover from the nuclear bubble burst.
Currently testing a semi-major Covid fib at $43.37
If it dips then watch the support zone $42.31-42.91

massive retest?Is $cco.to NYSE:CCJ going to retest the MASSIVE important level that goes back 18 years?
#uranium #u308

Retesting Low of Lows on Cameco. CCJThe technical signal has been shown for the bearish side. And it may drop further. There is a tendency for markets to retest an important price level 2 or three times, after which the whole dynamic pivots and we go the other way. There is no way to tell if and when this is going to happen and that i

Cameco In TroubleMy goodness the Cameco daily chart looks ominous...
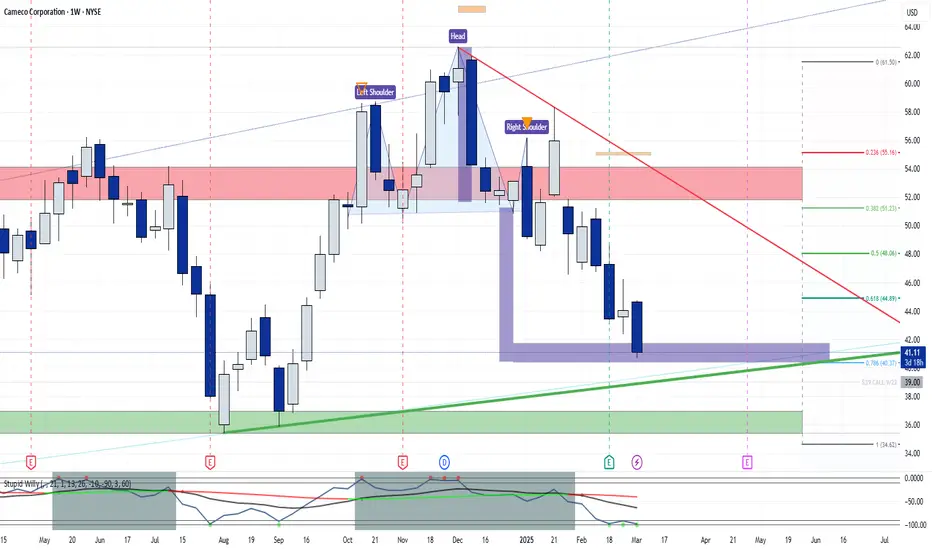
Is that a valid head and shoulders top with a back test in progress?
In any case, price still below resistance and declining 36 day moving average.
Not a place to enter, even if it does manage to invalidate the breakdown.

Cameco Corporation (US) Stock Quote | Chart & Forecast SummaryKey Indicators On Trade Set Up In General
1. Push Set Up
2. Range Set up
3. Break & Retest Set Up
Notes On Session
# Cameco Corporation (US) Stock Quote
- Double Formation
* 43.00 USD | Area Of Value
* 52.00 USD | Downtrend Continuation | Subdivision 1
- Triple Formation
* (Neckline) | Entry Bias |


CCJ cup and handle forms as new ath is reachedCCJ has been overlooked these past years, overshadowed by crypto and AI. But someone needs to power these new innovations with energy as well, the answer is uranium. Which could mean fundamentals are also in place.

[Short-Term] Cameco is bouncing right now.. Pre-Recession?Good day, welcome to my analysis on GETTEX:CJ6 current standpoint from a technical view.
Please be informed that this is just a short-term analysis, my long term analyses and fundamental analyses can be found here:
Bullish on Cameco - Show will go on
From Fibonacci retracement, we can see C

See all ideas
Displays a symbol's price movements over previous years to identify recurring trends.