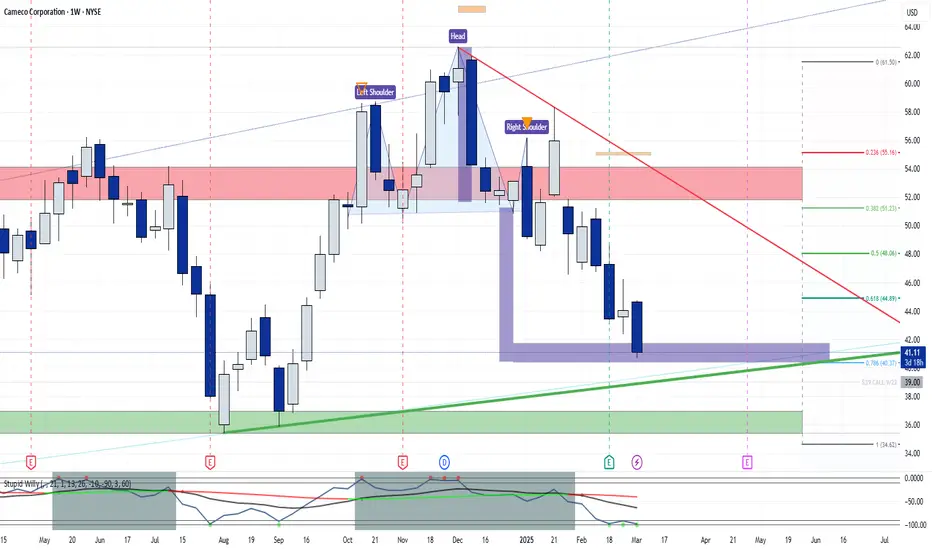
CCJ Gets Another Bounce from Key Demand ZoneCameco has bounced from the key demand zone at 32.50–35.50 for the sixth time, further confirming this area as a significant support level. The 200-day moving average also played a major role in the bounce, acting as a magnet. In the last three instances, when the price moved nearly 20% below the 200-day SMA, an upward reaction followed, this time marks the fourth occurrence of the same pattern.
However, NYSE:CCJ continues to face pressure from falling uranium prices, which have been declining for nearly 14 months. While long-term prospects remain positive due to growing investments in nuclear energy, the medium-term outlook remains uncertain. A breakdown below the 32.50–35.50 zone could lead to intensified bearish pressure.
On the upside, the 40.00 and 46.40 levels are key short-term resistance zones that traders should watch.
CCJ trade ideas

massive retest?Is $cco.to NYSE:CCJ going to retest the MASSIVE important level that goes back 18 years?
#uranium #u308

Retesting Low of Lows on Cameco. CCJThe technical signal has been shown for the bearish side. And it may drop further. There is a tendency for markets to retest an important price level 2 or three times, after which the whole dynamic pivots and we go the other way. There is no way to tell if and when this is going to happen and that is why trading is hard and awesome.

Cameco In TroubleMy goodness the Cameco daily chart looks ominous...
Is that a valid head and shoulders top with a back test in progress?
In any case, price still below resistance and declining 36 day moving average.
Not a place to enter, even if it does manage to invalidate the breakdown.

Cameco Corporation (US) Stock Quote | Chart & Forecast SummaryKey Indicators On Trade Set Up In General
1. Push Set Up
2. Range Set up
3. Break & Retest Set Up
Notes On Session
# Cameco Corporation (US) Stock Quote
- Double Formation
* 43.00 USD | Area Of Value
* 52.00 USD | Downtrend Continuation | Subdivision 1
- Triple Formation
* (Neckline) | Entry Bias | Long Support | Subdivision 2
* Head & Shoulders Structure | Reversal | Subdivision 3
* Daily Time Frame | Trend Settings Condition
Active Sessions On Relevant Range & Elemented Probabilities;
European Session(Upwards) - US-Session(Downwards) - Asian Session(Ranging)
Conclusion | Trade Plan Execution & Risk Management On Demand;
Overall Consensus | Sell


CCJ cup and handle forms as new ath is reachedCCJ has been overlooked these past years, overshadowed by crypto and AI. But someone needs to power these new innovations with energy as well, the answer is uranium. Which could mean fundamentals are also in place.

[Short-Term] Cameco is bouncing right now.. Pre-Recession?Good day, welcome to my analysis on GETTEX:CJ6 current standpoint from a technical view.
Please be informed that this is just a short-term analysis, my long term analyses and fundamental analyses can be found here:
Bullish on Cameco - Show will go on
From Fibonacci retracement, we can see Cameco is bouncing around at fib 0 from November 15th indicating a possible movement of direction.
A Fibonacci retracement from Nov. 19th to yesterday's high wick shows the current movement is between fib 0.2 and fib 0.6 (open to close) with today's wick (as of now) laying just above fib 0.7.
Yes, these are pretty short term Fibonacci's, but considering Cameco is at its all-time high, no longer term analysis seems fitting for me.
Now, here are the possibilities:
Recession:
Cameco may go into a short-term recession. I would put the maximum low at around fib 0.2 or the higher low / demand zone from November 20th, which would be €54 or €53 retrospectively.
Uptrend:
Cameco may continue its uptrend until it settles at a new All-Time High. No expected numbers from me.
Update:
While writing this, MT Newswire posted an article called “RBC Raises Price Target on Cameco to CA$90 From CA$75, ”. The possibility of a short-term recession is getting lower, through the uptrend Cameco had while I'm writing this. Anyway, I don't want to have such short term prognoses, therefore I will still be listing this as a neutral.
I hope you've enjoyed this analysis, please read my longer term analyses on Cameco listed below.
Have a pleasant day and may you never exit before the bull run begins.
-- Henrik B.

Bullish on Cameco - Show will go onGood evening everyone, today we will be talking about Cameco, again.
I still stand to my previous analyses of Cameco (Linked below), regarding its long term potential. Cameco kind of became my favourite stock to analyse now… At least one of the few ones I regularly post on.
Anyway, the more well known indicators like the MACD and Bollinger Bands signal a bullish outlook , as well as some new ones I read into recently.
The Lorentzian Classification and Euclidean Distance Prediction machine learning based indicators, which read into historical candle chart patterns to determine a future outlook by probability, blah blah — Don't want to get into the science behind too much, as this is beautifully described in other publications and definitely not an easy topic.
I've back tested both the LC and EDP indicators (Through Replay Trading) and found especially the Lorentzian to be really valuable in this stock. The Lorentzian Classification shows a confidence of 8 , which is high, and the Euclidean shows a good near future outlook.
The overall technical and analyst rating by Trading View is also a strong buy.
I modified the Euclidean script a little, to predict the next two candles, so please don't worry about my chart looking so different.
Yes, Cameco is scratching its all-time high right now, but I still think Cameco will surpass it by lots. They raised their 2024 production outlook and maintain strong cash flow projections, even though their Q3 EPS came in at a loss. And they recovered from their 7.6% drop on November 7th it recovered in three hours.
This time, I sadly have no price predictions for you, just my current take on Cameco
Don't forget to read my previous long-term analysis of GETTEX:CJ6 which still applies fully.
I hope you have a wonderful day. I would kindly ask you, to share suggestions and your own thoughts in the comments. Thank you and may your levers never be knocked out!
-- Henrik B.

CCJ cup & handle Breakout to 65 & 70+Cameco Corporation (CCJ) is currently displaying a classic cup and handle pattern, a bullish continuation signal. Here’s a breakdown of the pattern and what to watch for:
Cup and Handle Breakdown:
The Cup:
A rounded base formed between April 2024 and October 2024, with the left and right peaks near $58.72 and a low around $46.76.This symmetrical cup formation indicates accumulation after a downtrend, with buyers gradually gaining strength.
The Handle:
After testing the $58.72 resistance level, the stock pulled back slightly to form a handle, consolidating around $55.66.
Handles are characterized by lower highs and decreasing volume, setting the stage for a breakout.
Volume:
Volume has declined during the handle formation, a textbook signal of the pattern. Look for a volume spike to confirm the breakout. Breakout Level (Rim of the Cup): $58.72
Projected Target: Add the cup depth to the breakout level: $58.72 + $11.96 = $70.68
Profit Targets:
First Target: $65.00
Second Target: $70.68
Bearish Contingency:
If the price breaks below $55.66 , the pattern is invalidated, and CCJ may test lower levels.

Huge upside after correction ahead Based on my Elliott wave analysis, we should see a correction to around $23 per share.
On the flip side, I could also imagine the correction being very shallow and possibly already over, though this is not my preferred scenario.
Comparing the Cameco wave count with the one of the Uranium-ETF, it becomes apparent that there is a clear divergence between the two. While the ETF has bin consolidating for a while now, Cameco has performed very well.
For that reason I would wait until a clear correction has occured and possibly already enter after the (A) has finished, in case the correction is already over at that point, closing the position again once the horizon clears up to show that the correction is actually a lot deeper.
All in all, a very interesting case, both technical and fundamental. China and India are both building whole cities worth of nuclear reactors, while production is barely picking up and takes years to expand due to regulation and geographic cost distribution.
Long-term price aim should be around $175 give or take.
Updates will follow

Cameco may grow 8.74% in the next five daysHey, welcome to another analysis of GETTEX:CJ6 by me. The focus of this analysis is solely on Short-Term growth. If you like to see my Long-Term take on the Stock, look at my previous fundamental analysis:
From my last analysis, Cameco sadly missed my previous Short-Term goal by roughly 2.0%, only gaining about 8.6% after my analysis. This was due to Cameco not hitting my “Definite Buy” line, which I used as reference. If it had hit the line, Cameco would have probably risen up to more than €40.00. Now, here is my more conservative analysis of the next five bar potential.
Cameco has an 8.74% growth potential in the next 5 bars (7 days) according to my analysis, to Fibonacci(0), located at the upper POI (Point of interest, in this case resistance line). This would throw the Stock at €39.135, before it will likely regress a little bit.
By extending the Fibonacci from the last lower POI (in this case support) we can see that there's an optimistic potential of getting to the “Maximum Target line”, which would mean a growth of about 10% to €40.158.
In terms of risk management, I would not recommend leverage above 10, as Cameco's support is set at €30.2, 16.65% down from current price, causing a total loss.
I hope you liked my analysis, I would kindly ask you, to share suggestions and your own thoughts in the comments. Thank you!
-- Henrik B.

Cameco Corp. (CJ6) is short term and long term bullish!Welcome to my first public analysis on this platform. Today, I am sharing my thoughts on GETTEX:CJ6 .
In my opinion, Cameco Corp. has a bullish outlook, both long-term and short-term.
When Cameco reaches the buy line at €35.174, there is a 14-day (10-bar) potential for up to 13.68%, based on Fibonacci retracement and MACD indicators. The buy line is validated by previous support levels and the Bollinger Bands, as shown in my chart.
Long-term potential:
Cameco's long-term potential is backed by several political and economic factors, especially in the context of global energy transitions and geopolitical developments.
1. Increased Focus on Nuclear Energy
The shift towards clean energy and decarbonization efforts has increased reliance on nuclear power as a reliable, low-carbon energy source. This global shift boosts uranium demand, of which Cameco is the largest supplier globally.
2. Geopolitical Risks and Uranium Supply
Ongoing political tensions and potential sanctions on Russian uranium put pressure on Western countries to diversify their supply chains. Since Russia is a key supplier of enriched uranium, potential restrictions could force Western nations to depend more heavily on Cameco, increasing long-term demand for its politically secure uranium supplies.
3. Western Energy Security Policies
With growing concerns over energy security, particularly in Europe, many governments are reducing reliance on Russian resources, including uranium. Governments may provide subsidies or support to companies like Cameco, ensuring stable and allied sources of uranium.
4. Supply Chain Tightness
Years of underinvestment, mine closures, and geopolitical risks have constrained the global uranium supply. As nuclear energy demand rises, supply shortages could push prices higher, benefiting Cameco as a top producer outside Russia.
5. Long-term Contracts with Utilities
Cameco has secured several long-term contracts with utilities in North America, Europe, and Asia. These contracts provide stability and predictability in revenue, especially important in a volatile geopolitical landscape where energy resource security is crucial.
---
Cameco Corp. is well-positioned for growth, driven by its strong foothold in the uranium market, favourable long-term contracts, and the geopolitical drive towards clean and secure energy solutions, making it an attractive long-term investment opportunity.
I will personally buy Cameco somewhere around the €36.00 mark, as I am not just interested in its short-term growth. I have not yet fully decided where I will put my Stop-Loss, though.
I hope you've enjoyed my Analysis and I would kindly ask you to write suggestions, corrections and or your own thoughts in the comments.
-- Henrik B.

Cameco Corp. (CCJ) is the perfect Long-Term investment now!Hey, I just analyzed GETTEX:CJ6 and now wanted to publish my Long-term ideas on NYSE:CCJ as I think it will get more reach here than on my preferred stock exchange.
If you want some details on my Short-Term analysis, feel free to check out as I don't want to adjust the numbers and the chart for a stock exchange I don't use myself.
Here's my chart of GETTEX:CJ6 if you're interested:
---
Cameco's long-term potential is backed by several political and economic factors, especially in the context of global energy transitions and geopolitical developments.
1. Increased Focus on Nuclear Energy
The shift towards clean energy and decarbonization efforts has increased reliance on nuclear power as a reliable, low-carbon energy source. This global shift boosts uranium demand, of which Cameco is the largest supplier globally.
2. Geopolitical Risks and Uranium Supply
Ongoing political tensions and potential sanctions on Russian uranium put pressure on Western countries to diversify their supply chains. Since Russia is a key supplier of enriched uranium, potential restrictions could force Western nations to depend more heavily on Cameco, increasing long-term demand for its politically secure uranium supplies.
3. Western Energy Security Policies
With growing concerns over energy security, particularly in Europe, many governments are reducing reliance on Russian resources, including uranium. Governments may provide subsidies or support to companies like Cameco, ensuring stable and allied sources of uranium.
4. Supply Chain Tightness
Years of underinvestment, mine closures, and geopolitical risks have constrained the global uranium supply. As nuclear energy demand rises, supply shortages could push prices higher, benefiting Cameco as a top producer outside Russia.
5. Long-term Contracts with Utilities
Cameco has secured several long-term contracts with utilities in North America, Europe, and Asia. These contracts provide stability and predictability in revenue, especially important in a volatile geopolitical landscape where energy resource security is crucial.
---
NYSE:CCJ Cameco Corp. is well-positioned for growth, driven by its strong foothold in the uranium market, favourable long-term contracts, and the geopolitical drive towards clean and secure energy solutions, making it an attractive long-term investment opportunity.
I hope you've enjoyed my Analysis and I would kindly ask you to write suggestions, corrections and or your own thoughts in the comments.
-- Henrik B.

CCJ Cameco Corporation Options Ahead of EarningsIf you haven`t bough CCJ before the previous earnings:
Now analyzing the options chain and the chart patterns of CCJ Cameco Corporation prior to the earnings report this week,
I would consider purchasing the 45usd strike price Calls with
an expiration date of 2025-1-17,
for a premium of approximately $5.55.
If these options prove to be profitable prior to the earnings release, I would sell at least half of them.


CCJ: Up Trend & Rising wedge Key Points : NYSE:CCJ
Sideways Trend
Rising Wedge Pattern
Short Term up trend is becoming weak.
Resistance - 55.83
Support - 51.14
If you need further analysis, please don’t hesitate to reach out. Feel free to contact me if you have any questions or concerns. If I can help in any way, please don’t hesitate to ask.

reversal candle$cco.to NYSE:CCJ printing an ominous weekly reversal candle at upper bound resist. Not a good look.
#uranium #u308

Small bunnySmall bunny graze at plains of $CCJ. It is little bit skinny now but has plenty of resources to feed on.

CCJ - Typically pulls back on new 52 week high - sold PutsChris,
After reflection I was wrong to recommend buying on the breakout yesterday (Friday, 4/12). Looking back at the past year I noticed that CCJ typically will retrace on a new high. A 61.8 fib retracement brings the stock back to the previous breakout and a gap which where I like to be a buyer on a bounce.
Joe pointed out "The premium for Put CCJ 40 9/21/24 is about $1.85.
For a strike price of 45, the premiums for CCJ range from $1.05 (May 10, 2024) to $8 (Jan 16, 2026)." Those premiums are on the upper end 52 week range of the volatility. Thanks for pointing out Joe.
I prefer shorter term premium and sold the May 45 for $1.19 which brings the B.E. price right to the 61.8 Fib. I would take assignment at that price.

CCJ.NYSE Cameco Corp Inverse Head & Shoulder Seen.Cameco Corp Inverse Head & Shoulder Seen and soon in Blue Sky Territory.
This is a fairly rare Pattern IMO.
In this Chart I've switched to the line view to reveal the pattern and remove candle clutter.
A good trick to use on longer time frames.
The Energy Sector is gaining due to the realisation that the World NEEDS MORE.
Past speculation about Nuclear has now made this a potential GREEN ENERGY Solution.
Uranium Stocks did rally, but there has been some selling and a pullback.
I still see plenty of Opportunity in this Sector.
As always, please get a few outside Expert's Advice before taking Trade or Investment Decisions.
Should you appreciate my Chart Studies, Smash That Rocket Boost Button. It's Just a Click away.
Regards Graham.
