DAX Bullish breakout supported at 23330Trend Overview:
The DAX index maintains a bullish overall sentiment, supported by a sustained rising trend on the higher timeframes. However, recent intraday price action suggests a corrective pullback and consolidation phase, likely part of a broader continuation pattern.
Key Support and Resistance Levels:
Support:
Initial support: 23,330 – a key previous consolidation area and pivot level
Below that: 23,170, then 22,970 as deeper retracement levels
Resistance:
Near-term upside target: 24,030
Further resistance: 24,130 and 24,345 over the longer term
Scenarios:
Bullish Continuation:
A bounce from 23,330 would confirm this level as valid support
Sustained strength could drive price toward 24,030, then 24,130 and 24,345
Bearish Breakdown:
A daily close below 23,330 would invalidate the bullish setup
Opens potential for deeper pullbacks toward 23,170 and 22,970
Conclusion:
The DAX remains bullish in structure but is currently consolidating. Watch the 23,330 support zone closely—its ability to hold will determine whether bulls regain control or if a deeper correction unfolds. A bounce here would favor upside targets; a confirmed breakdown shifts the outlook to short-term bearish.
This communication is for informational purposes only and should not be viewed as any form of recommendation as to a particular course of action or as investment advice. It is not intended as an offer or solicitation for the purchase or sale of any financial instrument or as an official confirmation of any transaction. Opinions, estimates and assumptions expressed herein are made as of the date of this communication and are subject to change without notice. This communication has been prepared based upon information, including market prices, data and other information, believed to be reliable; however, Trade Nation does not warrant its completeness or accuracy. All market prices and market data contained in or attached to this communication are indicative and subject to change without notice.
DE40 trade ideas

Bullish bounce off 50% Fibonacci support?DAX40 (DE40) is falling towards the pivot and could bounce to the 1st resistance.
Pivot: 23,409.26
1st Support: 23,261.27
1st Resistance: 23,759.37
Risk Warning:
Trading Forex and CFDs carries a high level of risk to your capital and you should only trade with money you can afford to lose. Trading Forex and CFDs may not be suitable for all investors, so please ensure that you fully understand the risks involved and seek independent advice if necessary.
Disclaimer:
The above opinions given constitute general market commentary, and do not constitute the opinion or advice of IC Markets or any form of personal or investment advice.
Any opinions, news, research, analyses, prices, other information, or links to third-party sites contained on this website are provided on an "as-is" basis, are intended only to be informative, is not an advice nor a recommendation, nor research, or a record of our trading prices, or an offer of, or solicitation for a transaction in any financial instrument and thus should not be treated as such. The information provided does not involve any specific investment objectives, financial situation and needs of any specific person who may receive it. Please be aware, that past performance is not a reliable indicator of future performance and/or results. Past Performance or Forward-looking scenarios based upon the reasonable beliefs of the third-party provider are not a guarantee of future performance. Actual results may differ materially from those anticipated in forward-looking or past performance statements. IC Markets makes no representation or warranty and assumes no liability as to the accuracy or completeness of the information provided, nor any loss arising from any investment based on a recommendation, forecast or any information supplied by any third-party.

DAX: Move Down Expected! Short!
My dear friends,
Today we will analyse DAX together☺️
The price is near a wide key level
and the pair is approaching a significant decision level of 23,509.95 Therefore, a strong bearish reaction here could determine the next move down.We will watch for a confirmation candle, and then target the next key level of 23,438.51..Recommend Stop-loss is beyond the current level.
❤️Sending you lots of Love and Hugs❤️

“GER40 Heist in Progress – Bearish Blueprint Deployed!”🦹♂️💼 “Operation: Black Forest Heist” – DAX Day/Swing Trade Plan 💼🦹♀️
📍Thief Trading Style | CFD Tactical Chart Blueprint | GER40 Recon Mission
🌟Hi! Hola! Ola! Bonjour! Hallo! Marhaba!🌟
Dear Money Movers, Risk Raiders & Precision Planners 🧠💸,
Suit up for a clean-cut operation on the Germany 40 (GER40) Index! 🎯
With our sharp-edged Thief Trading blueprint 🔪, we’re scanning for a potential bearish trap—market’s heating up with oversold setups and momentum cracks near key resistance. Watch for the green MA zone—we suspect it's where bullish imposters hide. 🕵️♂️📉
🔓 Entry Plan
“The vault’s cracking... get ready!”
Wait for price to breach the ATR Line (23000.0). Once the level is crossed cleanly, it’s go-time:
🧨 Use Sell Stop orders just under the breakout
🎣 Or hunt pullback setups on 15m/30m charts with Sell Limit entries at resistance
🔐 Stop-Loss Strategy
Keep it tight. Protect your loot.
🚧 Place SL around swing high/low on the 4H chart (e.g. 23400.0)
⚖️ Adapt SL based on lot size, risk appetite, and number of entries
🎯 Target Zone
Mission Objective: 22600.0
Or exit earlier if the security alarm (price action shift) starts ringing. Don't get greedy—get out smart. 💼🚪💨
📉 Market Outlook:
Current trend: Neutral but suspiciously wobbly – early signs of bearish dominance. 🐻
This trade aligns with multiple signals:
📊 Technical: Consolidation near highs
💼 Fundamental: Macro & news risks
🧠 Sentiment: Crowd leaning long = opportunity for reversal
📰 Caution Note – News Events = Laser Tripwires
Stay sharp during releases!
Avoid new setups when big headlines drop
Use trailing stops to secure gains on running trades
Position smart, manage tighter, act quicker 🕶️
💥 Smash that Boost Button if this plan sharpens your edge or adds value to your mission! 💥
Together, we move like shadows and strike like lightning—Thief Traders never miss a clean setup.⚔️🕵️♀️
Stay tuned for the next raid… the market’s full of opportunities waiting to be unlocked. 🗝️🚀

GER40 Short The trend on this trade has finally started to turn so we can expect the start of the short season
H4, H1, and M15 are overbought
There are 2 clear patterns on H1 and M30
There is a head and shoulders present in M15 with massive divergence
Stoploss above 150 pips
First target at 23300

DAX40 INTRADAY Bullish breakout support at 23330Trend Overview:
The DAX index maintains a bullish overall sentiment, supported by a sustained rising trend on the higher timeframes. However, recent intraday price action suggests a corrective pullback and consolidation phase, likely part of a broader continuation pattern.
Key Support and Resistance Levels:
Support:
Initial support: 23,330 – a key previous consolidation area and pivot level
Below that: 23,170, then 22,970 as deeper retracement levels
Resistance:
Near-term upside target: 24,030
Further resistance: 24,130 and 24,345 over the longer term
Scenarios:
Bullish Continuation:
A bounce from 23,330 would confirm this level as valid support
Sustained strength could drive price toward 24,030, then 24,130 and 24,345
Bearish Breakdown:
A daily close below 23,330 would invalidate the bullish setup
Opens potential for deeper pullbacks toward 23,170 and 22,970
Conclusion:
The DAX remains bullish in structure but is currently consolidating. Watch the 23,330 support zone closely—its ability to hold will determine whether bulls regain control or if a deeper correction unfolds. A bounce here would favor upside targets; a confirmed breakdown shifts the outlook to short-term bearish.
This communication is for informational purposes only and should not be viewed as any form of recommendation as to a particular course of action or as investment advice. It is not intended as an offer or solicitation for the purchase or sale of any financial instrument or as an official confirmation of any transaction. Opinions, estimates and assumptions expressed herein are made as of the date of this communication and are subject to change without notice. This communication has been prepared based upon information, including market prices, data and other information, believed to be reliable; however, Trade Nation does not warrant its completeness or accuracy. All market prices and market data contained in or attached to this communication are indicative and subject to change without notice.

DAX H1 | Rising into an overlap resistanceThe DAX (GER30) is rising towards an overlap resistance and could potentially reverse off this level to drop lower.
Sell entry is at 23,858.94 which is an overlap resistance that aligns closely with the 61.8% Fibonacci retracement.
Stop loss is at 24,200.00 which is a level that sits above the 78.6% Fibonacci retracement and an overlap resistance.
Take profit is at 23,531.83 which is a pullback support that aligns the 38.2% Fibonacci retracement.
High Risk Investment Warning
Trading Forex/CFDs on margin carries a high level of risk and may not be suitable for all investors. Leverage can work against you.
Stratos Markets Limited (tradu.com ):
CFDs are complex instruments and come with a high risk of losing money rapidly due to leverage. 63% of retail investor accounts lose money when trading CFDs with this provider. You should consider whether you understand how CFDs work and whether you can afford to take the high risk of losing your money.
Stratos Europe Ltd (tradu.com ):
CFDs are complex instruments and come with a high risk of losing money rapidly due to leverage. 63% of retail investor accounts lose money when trading CFDs with this provider. You should consider whether you understand how CFDs work and whether you can afford to take the high risk of losing your money.
Stratos Global LLC (tradu.com ):
Losses can exceed deposits.
Please be advised that the information presented on TradingView is provided to Tradu (‘Company’, ‘we’) by a third-party provider (‘TFA Global Pte Ltd’). Please be reminded that you are solely responsible for the trading decisions on your account. There is a very high degree of risk involved in trading. Any information and/or content is intended entirely for research, educational and informational purposes only and does not constitute investment or consultation advice or investment strategy. The information is not tailored to the investment needs of any specific person and therefore does not involve a consideration of any of the investment objectives, financial situation or needs of any viewer that may receive it. Kindly also note that past performance is not a reliable indicator of future results. Actual results may differ materially from those anticipated in forward-looking or past performance statements. We assume no liability as to the accuracy or completeness of any of the information and/or content provided herein and the Company cannot be held responsible for any omission, mistake nor for any loss or damage including without limitation to any loss of profit which may arise from reliance on any information supplied by TFA Global Pte Ltd.
The speaker(s) is neither an employee, agent nor representative of Tradu and is therefore acting independently. The opinions given are their own, constitute general market commentary, and do not constitute the opinion or advice of Tradu or any form of personal or investment advice. Tradu neither endorses nor guarantees offerings of third-party speakers, nor is Tradu responsible for the content, veracity or opinions of third-party speakers, presenters or participants.

Potential bullish rise?DAX40 (DE40) is reacting off the pivot and could rise from this level to the 1st resistance which aligns with the 78.6% Fibonacci retracement.
Pivot: 23,602.60
1st Support: 23,390.34
1st Resistance: 24,148.42
Risk Warning:
Trading Forex and CFDs carries a high level of risk to your capital and you should only trade with money you can afford to lose. Trading Forex and CFDs may not be suitable for all investors, so please ensure that you fully understand the risks involved and seek independent advice if necessary.
Disclaimer:
The above opinions given constitute general market commentary, and do not constitute the opinion or advice of IC Markets or any form of personal or investment advice.
Any opinions, news, research, analyses, prices, other information, or links to third-party sites contained on this website are provided on an "as-is" basis, are intended only to be informative, is not an advice nor a recommendation, nor research, or a record of our trading prices, or an offer of, or solicitation for a transaction in any financial instrument and thus should not be treated as such. The information provided does not involve any specific investment objectives, financial situation and needs of any specific person who may receive it. Please be aware, that past performance is not a reliable indicator of future performance and/or results. Past Performance or Forward-looking scenarios based upon the reasonable beliefs of the third-party provider are not a guarantee of future performance. Actual results may differ materially from those anticipated in forward-looking or past performance statements. IC Markets makes no representation or warranty and assumes no liability as to the accuracy or completeness of the information provided, nor any loss arising from any investment based on a recommendation, forecast or any information supplied by any third-party.

Technical Weekly AnalysisStart your week by identifying the key price levels and trends.
The SpreadEx Research team has analysed the most popular markets, including stocks, indices, commodities & forex.
--------------------------------------------------------------------------------------------------------------
Analysis
Germany 40 has turned bearish and is now in an impulsive move lower. It is trading at 23,222, notably below its VWAP of 23,732. The RSI at 39 signals weak momentum. Support is seen at 22,867, with resistance higher at 24,597.
UK 100 remains in a bullish trend but has shifted into a correction phase. The index trades at 8,778, slightly below its VWAP of 8,831. The RSI is at 50, showing a balanced momentum. Support lies at 8,750, with resistance at 8,904.
Wall Street continues in its bullish trend but is undergoing a correction. It is trading at 42,249, just under the VWAP at 42,460. The RSI at 51 suggests a neutral outlook. Support is at 41,857, and resistance stands at 43,062.
Brent Crude is in a very strong bullish impulsive phase, trading at 7,633 above its VWAP of 7,015. The RSI at 66 indicates strong upward momentum. Support is at 6,016, while resistance is found at 8,015.
Gold remains bullish but is now in a correction/sideways phase. It trades at 3,364, very close to its VWAP of 3,360. The RSI at 52 implies a neutral to slightly bullish sentiment. Support is at 3,289, with resistance at 3,438.
EUR/USD continues in a bullish correction phase, with the pair trading at 1.1475 - down from the recent 3yr high - and its VWAP close at 1.1450. RSI is steady at 54, suggesting moderate buying interest. Support is at 1.1338, and resistance is at 1.1592.
GBP/USD is still bullish but in a correction phase, currently trading at 1.3390, just below the VWAP at 1.3512. RSI at 42 points to weakening momentum. Support is at 1.3380, with resistance at 1.3639.
USD/JPY has broken out above a triangle pattern into a bullish impulsive run, trading at 147.86, well above its VWAP of 144.52. RSI at 67 confirms strong buying pressure. Support is at 142.04, and resistance is at 147.01.

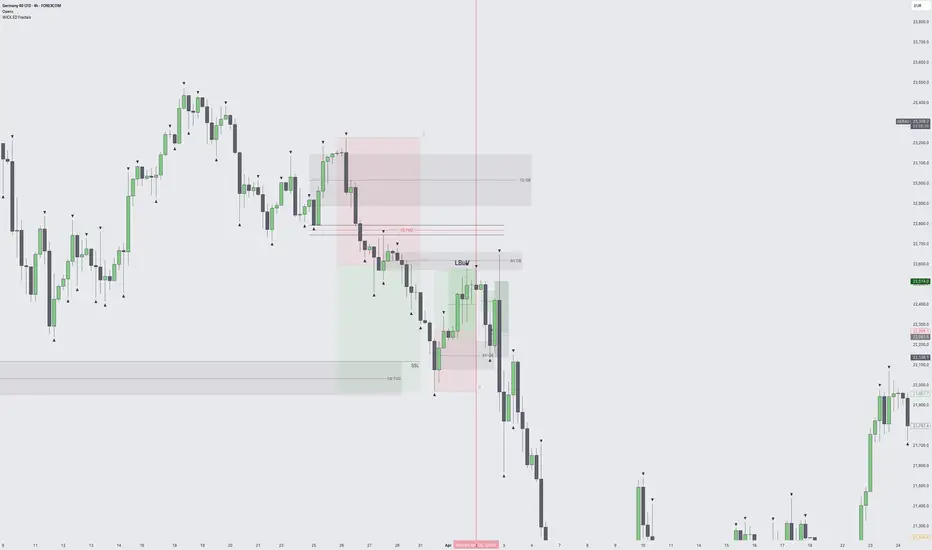
New Week new Dax <3 and once a swing trade here we got Liq but did not test the zone I expected but also did not break the bias means we are going to test it this week as soon as we show reaction then wait for the retest and pick one of the three tps with a buy stop ^^

DE40 H4 Analysis 23 Jul to 27 Jul - Bullish FlagDE40 Showing a bullish Flag 23,735 - 23,800. If it breaks this zone, Most probably can fly upto 24,466 and higher. Take your risk under control and wait for market to break support or resistance on smaller time frame. Best of luck everyone and happy trading.🤗

DAX weekly Analysis
As per OMFA strategy which is hybrid of Volume profile, ICT, Price action, and chart pattern, here is the DAX weekly Analysis.

DAX: Target Is Up! Long!
My dear friends,
Today we will analyse DAX together☺️
The recent price action suggests a shift in mid-term momentum. A break above the current local range around 23,435.79 will confirm the new direction upwards with the target being the next key level of 23,572.93 and a reconvened placement of a stop-loss beyond the range.
❤️Sending you lots of Love and Hugs❤️

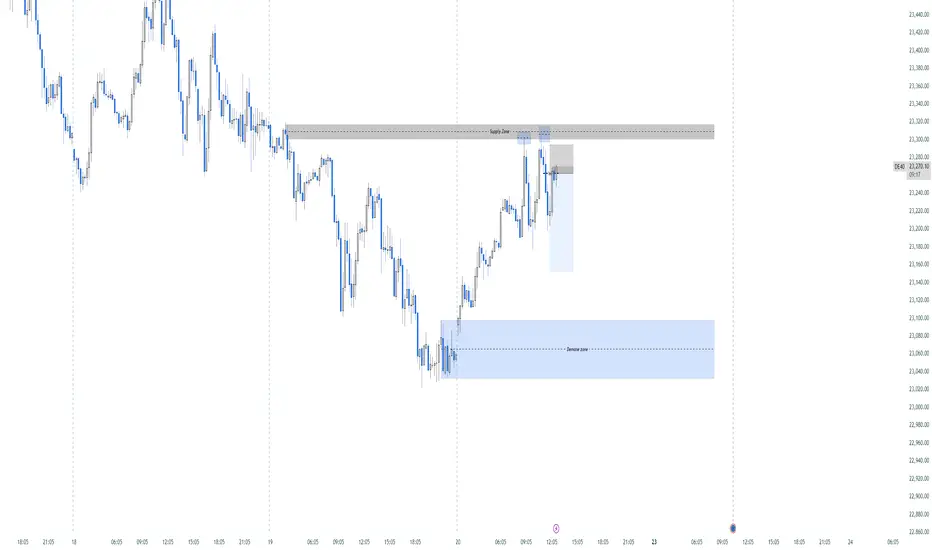
Possible Sell On Dax. Every thing taken into account, dax could shortly see a sell, given that a 1h Supply zone and 5 minute candles were rejected twice.
DAX H1 | Downtrend to extend deeper?The DAX (GER30) is rising towards a swing-high resistance and could potentially reverse off this level to drop lower.
Sell entry is at 22,230.41 which is a swing-high resistance that aligns closely with the 23.6% Fibonacci retracement.
Stop loss is at 23,460.00 which is a level that sits above the 50% Fibonacci retracement and a swing-high resistance.
Take profit is at 22,913.31 which is a swing-low support.
High Risk Investment Warning
Trading Forex/CFDs on margin carries a high level of risk and may not be suitable for all investors. Leverage can work against you.
Stratos Markets Limited (tradu.com ):
CFDs are complex instruments and come with a high risk of losing money rapidly due to leverage. 63% of retail investor accounts lose money when trading CFDs with this provider. You should consider whether you understand how CFDs work and whether you can afford to take the high risk of losing your money.
Stratos Europe Ltd (tradu.com ):
CFDs are complex instruments and come with a high risk of losing money rapidly due to leverage. 63% of retail investor accounts lose money when trading CFDs with this provider. You should consider whether you understand how CFDs work and whether you can afford to take the high risk of losing your money.
Stratos Global LLC (tradu.com ):
Losses can exceed deposits.
Please be advised that the information presented on TradingView is provided to Tradu (‘Company’, ‘we’) by a third-party provider (‘TFA Global Pte Ltd’). Please be reminded that you are solely responsible for the trading decisions on your account. There is a very high degree of risk involved in trading. Any information and/or content is intended entirely for research, educational and informational purposes only and does not constitute investment or consultation advice or investment strategy. The information is not tailored to the investment needs of any specific person and therefore does not involve a consideration of any of the investment objectives, financial situation or needs of any viewer that may receive it. Kindly also note that past performance is not a reliable indicator of future results. Actual results may differ materially from those anticipated in forward-looking or past performance statements. We assume no liability as to the accuracy or completeness of any of the information and/or content provided herein and the Company cannot be held responsible for any omission, mistake nor for any loss or damage including without limitation to any loss of profit which may arise from reliance on any information supplied by TFA Global Pte Ltd.
The speaker(s) is neither an employee, agent nor representative of Tradu and is therefore acting independently. The opinions given are their own, constitute general market commentary, and do not constitute the opinion or advice of Tradu or any form of personal or investment advice. Tradu neither endorses nor guarantees offerings of third-party speakers, nor is Tradu responsible for the content, veracity or opinions of third-party speakers, presenters or participants.

German 40 Index – Sentiment Facing a Sterm TestSince hitting its most recent all time high of 24469 on June 5th the Germany 40 index has experienced some downside pressure as traders have moved to lock in profits on a very strong start to the year. This move has the potential to turn June into the worst monthly performance of 2025 so far, although there is still another 8 trading days to go.
This short-term shift in sentiment has been related to a combination of factors. The new all time high of 24469 hit on June 5th coincided with the latest ECB interest rate cut. However, at that meeting Madame Lagarde indicated in the press conference that more data on the path of inflation, trade tariffs with the US and Eurozone growth would be required before the ECB would consider cutting interest rates again.
This was followed by comments and headlines which suggested that progress on a trade deal between the US and EU was slow and would potentially continue past the original July 9th pause deadline set by President Trump.
Then in the last week sentiment has been rocked further by the spike in Oil prices driven by an escalating conflict between Israel and Iran that has seen them trade missile attacks for 7 straight days, alongside a growing concern that the US may also be seriously considering entering a direct conflict with Iran after Bloomberg reported yesterday that senior US officials are preparing for a possible strike in the coming days.
At the time of writing (0700 BST) this leaves the Germany 40 trading at 1 month lows around 23142 and suggests a consideration of the technical outlook, including potential support and resistance levels could be useful.
Technical Update: Watching 23235 Last Correction Low
Having posted a new all-time high on June 5th at 24469, a more extended price correction has developed in the Germany 40 index. Interestingly, as the chart below shows, this phase of weakness has seen closing breaks under what some might have anticipated would be support, marked by the Bollinger mid-average (currently 23862).
In previous reports, we have suggested that traders may use the Bollinger mid-average as an indicator of the possible direction of the current price trend. If the mid-average is rising with prices above it, the trend may be classed as an uptrend, while if the mid-average is falling with price activity below it, a downtrend might be in place.
As the chart shows, following the latest breaks below the mid-average, this has now turned lower, and traders might now be focusing on the possibilities for an extended phase of price weakness.
Let's consider the possible support or resistance levels that could be worthwhile for traders to focus on.
Potential Support Levels:
With Thursday’s initial price activity so far seeing further selling pressure, as the chart below shows, it might be suggested the next relevant support is already currently being tested with moves below 23235. This level is equal to the last correction low posted on May 23rd at 23235.
Traders might now be watching how this 23235 low support is defended on a closing basis over coming sessions, as confirmed breaks lower, while no guarantee of deeper price declines, might skew risks towards tests of the next potential support at 22303, which is equal to the 38.2% retracement of April 7th to June 5th strength.
Potential Resistance Levels:
Since the June 5th all-time high, an extended decline in price has already been seen, so a reactive recovery might be a possibility. However, having recently seen the mid-average turn lower, closing breaks back above its current 23862 level might now be required to trigger a phase of price recovery.
While much will depend on future price trends and market sentiment, if successful upside breaks above the 23862 mid-average are seen, it might lead to tests of 24469 which is the June 5th all-time high.
The material provided here has not been prepared accordance with legal requirements designed to promote the independence of investment research and as such is considered to be a marketing communication. Whilst it is not subject to any prohibition on dealing ahead of the dissemination of investment research, we will not seek to take any advantage before providing it to our clients.
Pepperstone doesn’t represent that the material provided here is accurate, current or complete, and therefore shouldn’t be relied upon as such. The information, whether from a third party or not, isn’t to be considered as a recommendation; or an offer to buy or sell; or the solicitation of an offer to buy or sell any security, financial product or instrument; or to participate in any particular trading strategy. It does not take into account readers’ financial situation or investment objectives. We advise any readers of this content to seek their own advice. Without the approval of Pepperstone, reproduction or redistribution of this information isn’t permitted.

DAX | Bearish Below 23810–23690, Targeting 23395 and 23160DAX | Technical Analysis
The price has stabilized below the pivot zone (23810 – 23690), confirming the continuation of bearish momentum.
📉 As long as the price remains below 23810 and 23690, the downtrend is expected to persist, with a potential move toward 23395. A confirmed break below this level could extend the decline toward 23160.
Pivot Zone: 23810 – 23690
Resistance Levels: 24085, 24300
Support Levels: 23395, 23160
Trend Outlook: Bearish Momentum

DAX Can today's 1D MA50 test start a new rally?Last time we looked at DAX (DE40) more than 2 months ago (April 04, see chart below), we took a long-term buy on the 1D MA200 (orange trend-line) and the bottom of the 2.5-year Channel Up, targeting 25400:
The price reacted favorably, rising almost instantly, almost hitting the top of the Channel Up on June 05. Since then it got rejected and pulled back to hit the 1D MA50 (blue trend-line) today.
Based on the previous Bullish Legs of the Channel Up, this seems to be a technical correction (blue ellipse patterns) that only served as a 1D MA50 test to accumulate more buyers and extend the uptrend.
If the current Bullish Leg rises as high as the previous one (+38%), we should be expecting 25900 by the end of Q3.
-------------------------------------------------------------------------------
** Please LIKE 👍, FOLLOW ✅, SHARE 🙌 and COMMENT ✍ if you enjoy this idea! Also share your ideas and charts in the comments section below! This is best way to keep it relevant, support us, keep the content here free and allow the idea to reach as many people as possible. **
-------------------------------------------------------------------------------
Disclosure: I am part of Trade Nation's Influencer program and receive a monthly fee for using their TradingView charts in my analysis.
💸💸💸💸💸💸
👇 👇 👇 👇 👇 👇

DAX topping formation “neckline” resistance at 23,700The DAX equity index remains in a bearish technical setup, in line with the prevailing downward trend. Recent price action is forming a corrective pullback, suggesting temporary relief within a broader negative structure.
Key Technical Levels:
Resistance: 23,700 (previous intraday consolidation zone)
Support levels:
22,880 (initial target)
22,640
22,500 (longer-term support)
Bearish Scenario:
If the index rallies toward the 23,700 resistance and faces a rejection, this would likely confirm a continuation of the downtrend. In that case, downside momentum could accelerate toward the 22,880, 22,640, and potentially 22,500 support zones over the longer term.
Bullish Alternative:
A breakout above 23,700, confirmed by a daily close, would invalidate the bearish outlook and shift momentum in favour of the bulls. This would open the door for a move toward 23,920 and possibly 24,100 resistance.
Conclusion:
The bias remains bearish unless the DAX can break and close above 23,700. Traders should watch for price action around this key level to confirm trend direction. A rejection favors short positions targeting lower support levels, while a breakout invites a shift to a more constructive outlook.
This communication is for informational purposes only and should not be viewed as any form of recommendation as to a particular course of action or as investment advice. It is not intended as an offer or solicitation for the purchase or sale of any financial instrument or as an official confirmation of any transaction. Opinions, estimates and assumptions expressed herein are made as of the date of this communication and are subject to change without notice. This communication has been prepared based upon information, including market prices, data and other information, believed to be reliable; however, Trade Nation does not warrant its completeness or accuracy. All market prices and market data contained in or attached to this communication are indicative and subject to change without notice.

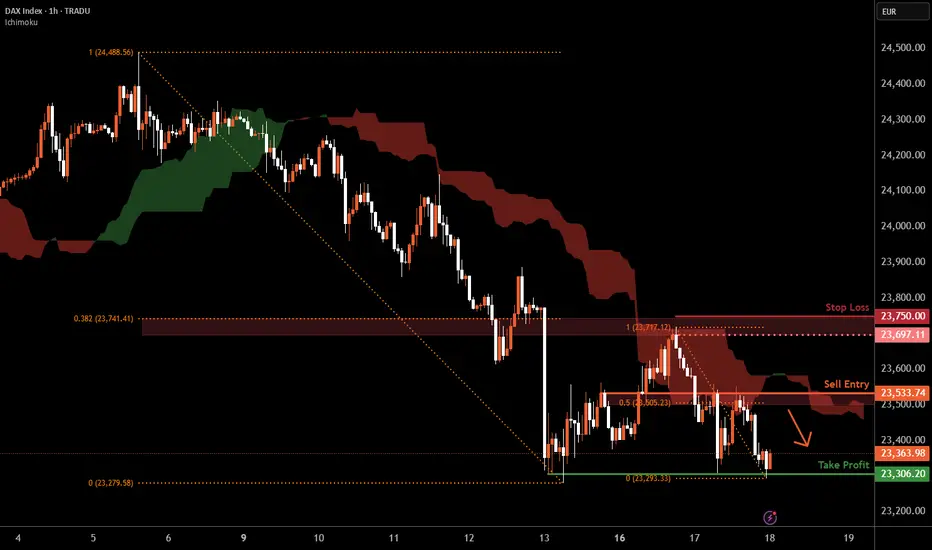
DAX H1 | Rising into a 50% Fibonacci resistanceThe DAX (GER30) is rising towards a pullback resistance and could potentially reverse off this level to drop lower.
Sell entry is at 23,533.74 which is a pullback resistance that aligns with the 50% Fibonacci retracement.
Stop loss is at 23,750.00 which is a level that sits above the 38.2% Fibonacci retracement and a swing-high resistance.
Take profit is at 23,306.20 which is a multi-swing-low support.
High Risk Investment Warning
Trading Forex/CFDs on margin carries a high level of risk and may not be suitable for all investors. Leverage can work against you.
Stratos Markets Limited (tradu.com ):
CFDs are complex instruments and come with a high risk of losing money rapidly due to leverage. 63% of retail investor accounts lose money when trading CFDs with this provider. You should consider whether you understand how CFDs work and whether you can afford to take the high risk of losing your money.
Stratos Europe Ltd (tradu.com ):
CFDs are complex instruments and come with a high risk of losing money rapidly due to leverage. 63% of retail investor accounts lose money when trading CFDs with this provider. You should consider whether you understand how CFDs work and whether you can afford to take the high risk of losing your money.
Stratos Global LLC (tradu.com ):
Losses can exceed deposits.
Please be advised that the information presented on TradingView is provided to Tradu (‘Company’, ‘we’) by a third-party provider (‘TFA Global Pte Ltd’). Please be reminded that you are solely responsible for the trading decisions on your account. There is a very high degree of risk involved in trading. Any information and/or content is intended entirely for research, educational and informational purposes only and does not constitute investment or consultation advice or investment strategy. The information is not tailored to the investment needs of any specific person and therefore does not involve a consideration of any of the investment objectives, financial situation or needs of any viewer that may receive it. Kindly also note that past performance is not a reliable indicator of future results. Actual results may differ materially from those anticipated in forward-looking or past performance statements. We assume no liability as to the accuracy or completeness of any of the information and/or content provided herein and the Company cannot be held responsible for any omission, mistake nor for any loss or damage including without limitation to any loss of profit which may arise from reliance on any information supplied by TFA Global Pte Ltd.
The speaker(s) is neither an employee, agent nor representative of Tradu and is therefore acting independently. The opinions given are their own, constitute general market commentary, and do not constitute the opinion or advice of Tradu or any form of personal or investment advice. Tradu neither endorses nor guarantees offerings of third-party speakers, nor is Tradu responsible for the content, veracity or opinions of third-party speakers, presenters or participants.
16-04-2025This chart contains my analysis and key observations for today's trading session. All drawings and indicators reflect my current view of the market as of today. The purpose of this publication is to keep a record of my analysis and review it later for learning and improvement. No investment advice is provided.

11-04-2025This chart contains my analysis and key observations for today's trading session. All drawings and indicators reflect my current view of the market as of today. The purpose of this publication is to keep a record of my analysis and review it later for learning and improvement. No investment advice is provided.

02-04-2025This chart contains my analysis and key observations for today's trading session. All drawings and indicators reflect my current view of the market as of today. The purpose of this publication is to keep a record of my analysis and review it later for learning and improvement. No investment advice is provided.