DXY I Just see BullsI want us to continue up from this 4HR CISD and IFVG. I don't want to see a sweep of any swing Low.
DXY trade ideas

My expectation for DXY todayBase on H4 price action, the direction is bullish.
now its looking for the support to bounce higher in my opinion.
Good luck

USD INDEXHello Traders.
This is my analysis for USD INDEX.
I am not a professional and I would be happy if you share your opinion in the comments.

USD Holds Key Res at 102 but Bulls Show Up at Higher-LowUSD came into the week with a full head of steam as price broke out to the 102.00 level on Monday. This was pushed by a strong move in USD/JPY testing 148 and EUR/USD testing 1.1100 - but then the Tuesday CPI report came out soft and that gave bulls reason to take profits on the USD.
That pullback ran vividly into early-Wednesday trade but at that point, support appeared at an important spot of prior resistance of 100.28, which was the neckline for the inverse head and shoulders pattern that led into last week's FOMC-fueled breakout.
That support has so far held and that keeps bulls in control of the trend on daily and four-hour charts. The key test now is a big batch of drivers for tomorrow morning with retail sales, PPI and a speech from FOMC Chair Jerome Powell.
At this point, EUR/USD retains bearish potential and USD/JPY bullish potential, which I'll touch on in a following post, and the door is open for Dollar bulls to make a move into the end of the week. On the other side of DXY, USD/CAD remains of interest as the pair has re-tested the psychological level of 1.4000. - js

USXUSD LOTWUSXUSD Higher Prices, LOTW Set
H4 FTB, H1 BOS
Expansive News day tomorrow with PPI and some more events in NY Session.
Let's see....

DXY Sell this rally. Bearish until end-of-year.The U.S. Dollar index (DXY) has been trading within a Channel Down since the September 26 2022 High and is currently on a medium-term Bearish Leg. The last 3 weeks however have been a short-term rebound (all 1W candles green), but the price is still below both the 1W MA200 (orang trend-line) and the 1W MA50 (blue trend-line).
This doesn't alter the bearish trend as this is not the first time we've seen this price action. More specifically, DXY also made a short-term rebound during the first Bearish Leg of the pattern and rebounded on January 30 2023 back to the 1W MA50. This delivered a strong rejection which eventually completed the Bearish Leg with one last round of selling to complete a -13.30% Bearish Leg in total.
Before that, we also saw the same pattern (also on 1W RSI terms) in 2020, when on August 31 2020 the price again had a short-term rebound only to resume the bearish trend and finish the sequence again at -13.40% from the top.
As a result, as long as the price remains (closes) below the 1W MA50, the last sell signal is given when the 1W RSI breaks above its MA (yellow trend-line) and then we can expect the Bearish Leg to complete a -13.30% decline with a 96.000 Target.
-------------------------------------------------------------------------------
** Please LIKE 👍, FOLLOW ✅, SHARE 🙌 and COMMENT ✍ if you enjoy this idea! Also share your ideas and charts in the comments section below! This is best way to keep it relevant, support us, keep the content here free and allow the idea to reach as many people as possible. **
-------------------------------------------------------------------------------
💸💸💸💸💸💸
👇 👇 👇 👇 👇 👇

USD overstretched to the downside as traders eye US retail salesApril retail sales data is scheduled to be released at 12:30 pm GMT tomorrow and will be a closely watched report as investors seek signs of any impact derived from tariffs, as well as potential future rate cuts by the US Federal Reserve (Fed).
According to LSEG Data and Analytics, economists expect retail sales to have stagnated, following a 1.5% gain in March – the largest one-month surge since the start of 2023; the estimate range is between a high of 0.4% and a low of -0.6%. Excluding autos, retail sales are anticipated to have cooled to 0.3%, down from March’s reading of 0.5%; however, estimates range from a high of 0.7% to a low of -0.5%.
Hard data is yet to follow soft data
Heading into the event, we are aware that soft data demonstrate a soft economy, which includes consumer and business sentiment surveys. In contrast, hard data has yet to follow suit and remains reasonably robust.
You will recall that CPI inflation data (Consumer Price Index) came in lower-than-expected in April, providing a modest shot in the arm for risk assets. Should retail sales come in stronger-than-anticipated, this could fan the fire and fuel the risk rally.
The April jobs report revealed that the US economy added 177,000 new payrolls according to the establishment survey. Consisting of 167,000 new private jobs and 10,000 government roles, this defied the market’s median estimate of 130,000, though it was lower than March’s downwardly revised reading of 185,000. According to the household survey, the population increased by 174,000, and the labour force grew by 518,000, resulting in a 0.1 percentage point increase in the labour force participation rate to 62.6%. As expected, the unemployment rate held steady at 4.2%, while average hourly earnings rose by less-than-expected on both a month-on-month and year-on-year basis, increasing by 0.2% (down from the 0.3% estimate) and 3.8% (down from 3.9% expected), respectively.
On the growth side, real GDP (Gross Domestic Product) – that is, economic activity adjusted for inflation – fell to an annualised rate of 0.3% in Q1 25. However, to clarify, this is the first estimate; there are three monthly estimates to complete the quarter, with the next being the preliminary and then the final print. According to the Bureau of Economic Analysis, the slowdown in growth was largely due to increased demand for imports. Nevertheless, according to the Atlanta Fed's GDPNow latest estimate (May 8), real GDP is now expected to grow at an annualised pace of 2.3% in Q2 2025.
USD Unwind?
According to the Commitment of Traders report (COT), the US dollar (USD) is overstretched to the downside, and the Citigroup Economic Surprise Index has been largely subdued, indicating that hard data has yet to be impacted by global trade tensions. This, coupled with the Fed in ‘wait-and-see’ mode and positive sentiment fuelling USD bids following the temporary US-China trade truce announced earlier this week, leads me to remain of the view that there is a solid backdrop for a higher USD. Consequently, my preference heading into the event would be to look for a beat in the data and possible long opportunities.
The USD index remains at monthly support at 99.67, but is struggling to overthrow the 50-month simple moving average (SMA) at 102.05, as well as daily resistance from 101.92/50-day SMA. As you can see from the charts below, daily support is now in play at 100.54, and, ultimately, I am looking for this level, along with the 38.2% Fibonacci retracement ratio at 100.45, to hold ground.
Written by FP Markets Chief Market Analyst Aaron Hill
.


Slower Inflation Growth, Takes DXY lower.Overnight, the DXY traded lower, driven by 2 main factors.
1) The release of lower-than-expected CPI data at 2.3%
2) Rejection of the long-term bearish trendline and the area of confluence formed by the 61.8% and 38.2% Fibonacci retracement levels from the longer term.
If the DXY breaks below the 38.2% Fibonacci retracement level of the shorter term, we could expect to see further downside, toward the target level of 100.
This round-number level would align with the 61.8% Fibonacci retracement level and the short-term bullish trendline.

Correction It is expected that the downtrend will end at the support levels and we will see the start of the uptrend. Otherwise, the downtrend may continue to the next support level.

USD Index (DXY) Short Setup: Reversal Expected from Resistance Z1. Entry Point: ~102.430
The price is currently below this level at 101.583, suggesting a potential short setup once the entry level is reached or confirmed.
2. Stop Loss: ~103.196
This is the price level where losses are limited if the trade moves against the intended direction. It's placed above a strong resistance zone.
3. Resistance Point: ~100.580
This was a previous resistance level which has now been broken, indicating a bullish push. The current price is above this, which may signal a breakout.
4. EA Target Point: ~97.857
The take-profit level, significantly lower, indicating a bearish target. This suggests a short position is intended from the entry point.
Indicators and Signals
The chart uses moving averages (likely 50 EMA and 200 EMA), and the price has surged above them, often a bullish signal.
However, the analysis seems to anticipate a reversal from the 102.430 level, expecting a drop back down toward 97.857.
The move from the current price to the target would be a 4.40% decline, a significant move for an index.
Trade Plan Summary
Trade Type: Likely a short/sell from the 102.430 level.
Risk: ~0.77 (103.196 - 102.430)
Reward: ~4.57 (102.430 - 97.857)
Risk-to-Reward Ratio: Approx. 1:6, which is favorable if the setup works out.

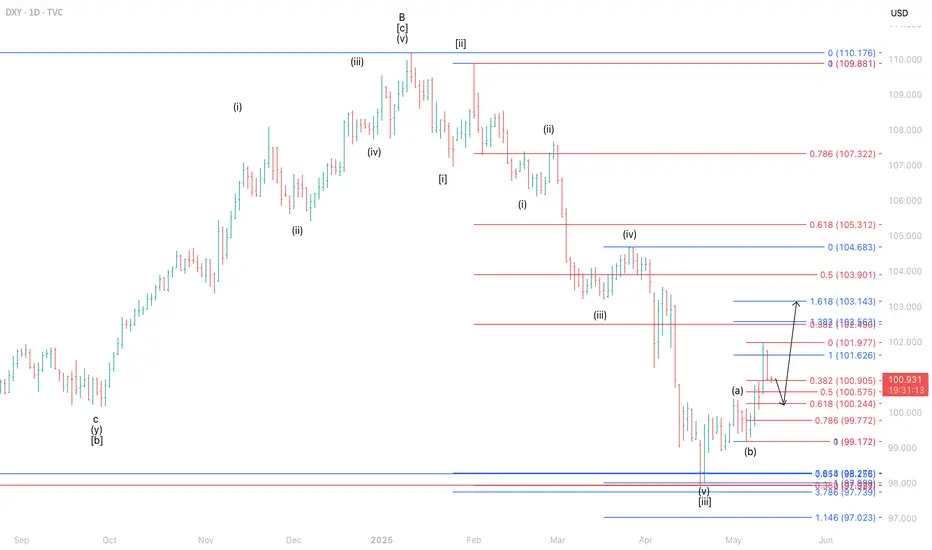
Short-Term Pullback Expected for DXY Before Potential ReboundThe current position of the DXY is estimated to be in wave ii of wave (c) of wave . This implies that the DXY remains vulnerable to a correction toward the 100.244–100.905 area. Subsequently, there is a potential for a rebound, with the index likely to retest the 102.563–103.143 zone.
$DXY Up, M2 Money Supply DownWhen the DXY goes UP,
M2 Money Supply goes DOWN.
Remember the 12-Week Lead correlation with CRYPTOCAP:BTC

Bullish bounce?US Dollar Index (DXY) is falling towards the pivot and could bounce to the 1st resistance.
Pivot: 100.37
1st Support: 99.93
1st Resistance: 102.02
Risk Warning:
Trading Forex and CFDs carries a high level of risk to your capital and you should only trade with money you can afford to lose. Trading Forex and CFDs may not be suitable for all investors, so please ensure that you fully understand the risks involved and seek independent advice if necessary.
Disclaimer:
The above opinions given constitute general market commentary, and do not constitute the opinion or advice of IC Markets or any form of personal or investment advice.
Any opinions, news, research, analyses, prices, other information, or links to third-party sites contained on this website are provided on an "as-is" basis, are intended only to be informative, is not an advice nor a recommendation, nor research, or a record of our trading prices, or an offer of, or solicitation for a transaction in any financial instrument and thus should not be treated as such. The information provided does not involve any specific investment objectives, financial situation and needs of any specific person who may receive it. Please be aware, that past performance is not a reliable indicator of future performance and/or results. Past Performance or Forward-looking scenarios based upon the reasonable beliefs of the third-party provider are not a guarantee of future performance. Actual results may differ materially from those anticipated in forward-looking or past performance statements. IC Markets makes no representation or warranty and assumes no liability as to the accuracy or completeness of the information provided, nor any loss arising from any investment based on a recommendation, forecast or any information supplied by any third-party.

After a rock-bottom RSI on DXY, is XAUUSD due for a fall? I thinIts no mystery that the DXY has an inverse mirroring relationship with XAUUSD. When DXY goes down, XAUUSD usually rises.
The RSI for DXY has been bottom of the barrel for a long time now, and combined with a recent break in structure, due certainly due for a temporary rise, which doesn't bode well for XAUUSD in the short term. I placed my SL around 3,254 and TP around 3,243, two key areas of support and resistance from an SMC perspective.

DXY road to 118.BULLISHUsing EWP ,DXY is printing wave Y of (Y) of X2 of a triple complex,targeting 117-118 resistance zone before an actionary wave Z drop all way to mid 90s

DXY Dual Perspective: Smart Money OB Short vs. Mid-Term LongThis chart presents two perspectives:
My Perspective (Dipanshu - GreenFireForex):
Expecting a bearish reversal from the current Order Block (OB) between 101.9 – 103.2, possibly due to inefficiency and early liquidity sweep.
ChatGPT’s Refined Perspective:
OB refined to 102.4 – 103.0 zone, aligning with imbalance and previous H4 structure break. A rejection from there is more probable.
Target:
Both views expect a drop toward the Demand Zone at 96.4 – 96.3, with bullish reversal expected from that key support.
Let’s observe whether the DXY respects early inefficiency or reaches full OB.
Comment your bias below!
---

DXY Rebound or Reversal? All Eyes on the Bearish OB Zone! Analysis:
As anticipated, DXY has now swept the major weekly/monthly sell-side liquidity (SSL) at 99.58, tapping deep into a high-probability reversal zone. This aggressive liquidity raid was followed by a sharp bullish reaction—marking the first signs of potential re-accumulation or a relief rally.
Currently, price is pushing back toward a bearish order block (OB) that aligns with a dense cluster of confluences:
A weekly FVG (Fair Value Gap)
A monthly FVG that’s been previously respected
Major supply resistance from previous highs around 108.40–109.39
This confluence zone is critical.
📍 Two Likely Scenarios:
Rejection from OB Zone: If price respects the OB, expect continuation to the downside—possibly targeting a deeper structural shift and breaking below the recent SSL.
Breakthrough & Reclaim: If price breaks and closes strongly above the OB zone, it opens the door for a move toward 114.60, the next major daily buy-side liquidity.
🧠 Either outcome offers a significant macro play, especially for risk-sensitive pairs (i.e., AUD, NZD, Gold, or equities inversely correlated to USD strength). Keep in mind, DXY's movement is heavily influenced by macroeconomic events, so dollar strength or weakness can cascade across global markets.
Key Levels to Watch:
Support: 100.215 / 99.58
Resistance: 108.40 → 109.39 OB zone
Upper Target if invalidated: 114.60
⚠️ DYOR. Let price confirm before bias is committed.

crypto & against dollar pairs dump. i'm calling it now.at this point i can pretty much say anything i want so it might as well be this lmfao

DXYWeekly timeframe, long-term analysis to know how this gonna affect XXXUSD Pairs
I talked about this on a video on 22 April, where I started with EURUSD first and spoke also about DXY

Bearish drop?US Dollar Index (DXY) is reacting off the pivot and could reverse to the 1st support.
Pivot: 102.05
1st Support: 100.41
1st Resistance: 103.28
Risk Warning:
Trading Forex and CFDs carries a high level of risk to your capital and you should only trade with money you can afford to lose. Trading Forex and CFDs may not be suitable for all investors, so please ensure that you fully understand the risks involved and seek independent advice if necessary.
Disclaimer:
The above opinions given constitute general market commentary, and do not constitute the opinion or advice of IC Markets or any form of personal or investment advice.
Any opinions, news, research, analyses, prices, other information, or links to third-party sites contained on this website are provided on an "as-is" basis, are intended only to be informative, is not an advice nor a recommendation, nor research, or a record of our trading prices, or an offer of, or solicitation for a transaction in any financial instrument and thus should not be treated as such. The information provided does not involve any specific investment objectives, financial situation and needs of any specific person who may receive it. Please be aware, that past performance is not a reliable indicator of future performance and/or results. Past Performance or Forward-looking scenarios based upon the reasonable beliefs of the third-party provider are not a guarantee of future performance. Actual results may differ materially from those anticipated in forward-looking or past performance statements. IC Markets makes no representation or warranty and assumes no liability as to the accuracy or completeness of the information provided, nor any loss arising from any investment based on a recommendation, forecast or any information supplied by any third-party.

DXY: Supply Zone Ahead – Possible Turning PointWelcome back! Let me know your thoughts in the comments!
** DXY Analysis !
We recommend that you keep this pair on your watchlist and enter when the entry criteria of your strategy is met.
Please support this idea with a LIKE and COMMENT if you find it useful and Click "Follow" on our profile if you'd like these trade ideas delivered straight to your email in the future.
Thanks for your continued support! Welcome back! Let me know your thoughts in the comments!

DXYT BUBBLES THROUGH 103.000'S .. The DXY completes its bearish sweep and is now reacting to a substantial demand zone around the 97.000s, prompting a potential pullback toward the 103.000s. Simultaneously, the gold market faces renewed supply pressure in alignment with fundamental drivers. Market participants should anticipate corrective moves across both assets. Follow for more insights , comment , and boost idea .
