Key Events That Could Shape the Dollar This Week🇺🇸 Key Events That Could Shape the Dollar This Week
Three major catalysts are on the radar for USD traders:
📊 ADP Employment Report
💰 Advance GDP (Q2)
🧠 Fed Chair Powell’s Speech
Additionally, ongoing trade developments with the EU may add to volatility.
📊 1. ADP Employment Report
The July ADP report is forecast to show 82K job additions. While this may seem consistent with recent NFP strength, several red flags suggest growing labor market weakness:
Decline in labor force participation
Slowing wage growth
Emerging contraction signals in the services sector
Even if ADP meets expectations, it may not reflect broad-based labor market health. Historically, ADP and NFP have often diverged—so the market reaction may be muted unless the data surprises meaningfully.
💰 2. Advance GDP (Q2)
Q2 GDP is expected to show modest growth, possibly supported by:
Higher tariff revenues boosting government income
A weaker dollar improving export competitiveness
Reduced imports due to elevated import costs
However, much of this growth is likely nominal rather than real. With inflation remaining sticky, headline GDP may be inflated by price effects rather than true economic expansion. Real GDP could remain flat or weak.
🧠 3. Fed Chair Powell’s Speech
This is arguably the most market-sensitive event of the week.
Goldman Sachs and other major banks believe the recent resilience in U.S. data lowers the chances of a rate cut at this meeting. However, political dynamics could add nuance:
With Donald Trump actively campaigning—and reportedly pressuring the Fed to ease rates to boost exports and growth—Powell may face a fine balancing act in his tone.
Markets will dissect every word for clues on future policy.
🌐 U.S.-EU Trade Developments
The U.S. recently announced a new trade agreement with the EU, including a 15% tariff on selected European imports.
In the short term, this could be dollar-supportive, as it:
Favors domestic producers
Reduces reliance on imports
Potentially improves the trade balance
Yet over the longer term, such tariffs can be inflationary and disrupt global supply chains—possibly complicating the Fed’s decision-making.
⚠️ Final Thought
In times of policy uncertainty, markets lose their predictability.
Tariffs, in particular, often have a stronger and more immediate impact than calendar-based economic data.
As a result, traders must monitor trade-related news and tariff decisions just as closely—if not more—than traditional economic releases in order to stay ahead of market direction and central bank decisions.
DXY trade ideas
A news-packed week.In this week, which could be considered the most news-packed week of the year, anything can happen. Due to the strength of the news, there's a high possibility that many of our analyses might fail, while many targets could also be hit.

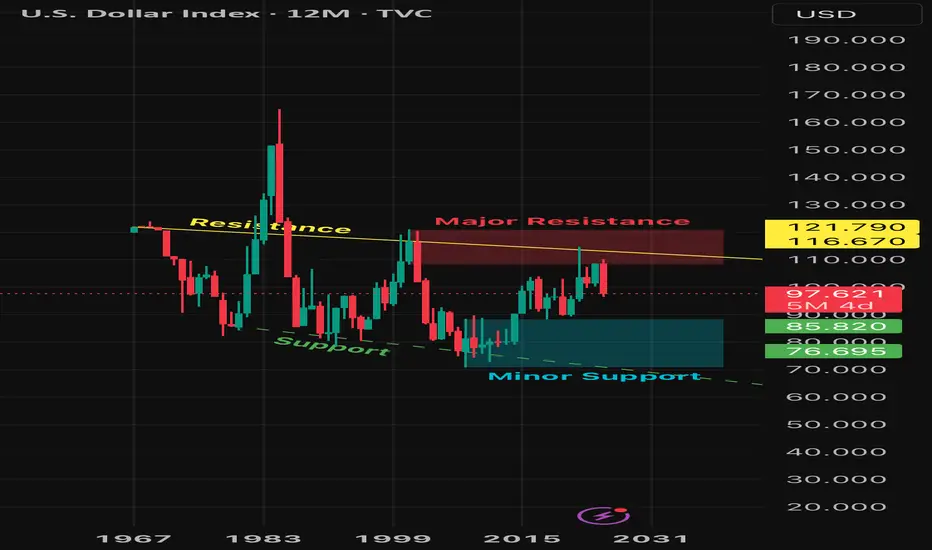
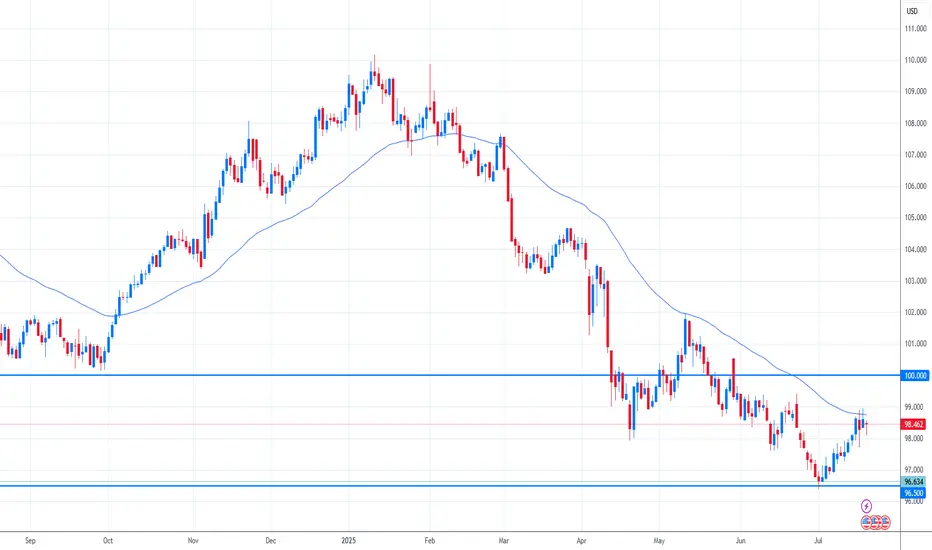
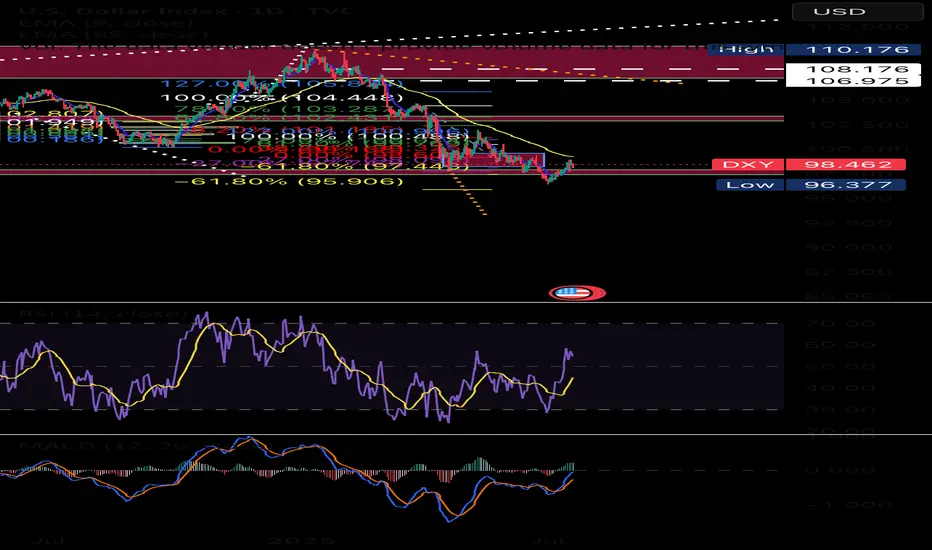
DXY: The Graceful Short This is interesting…Ever since the birth of Bitcoin, the DXY was in an overall uptrend, but that uptrend may have ended in the resistance zone. Price seems to have reversed for the DXY especially after the formation of a bearish engulfing candle on the 6M timeframe. Price may end the year within or on top of the support zone.
What does this mean for crypto and other assets?
If the DXY has reversed and is now in a long term down trend, crypto currencies and other assets will be in long term uptrends! Bitcoin may skip its upcoming bearish year next year or more than likely the bearish year will happen but the retracement may be short. Stay tuned!
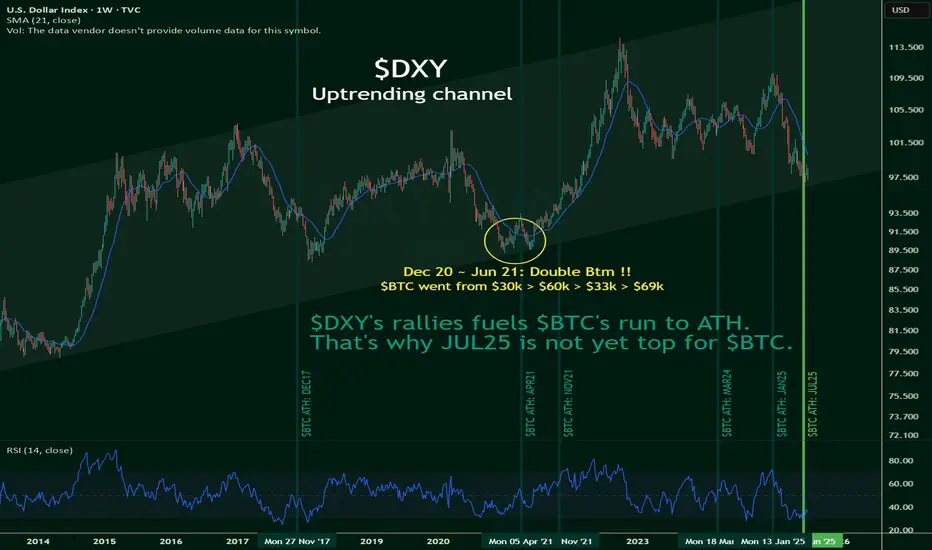
$BTC's run to ATH is fueled by $DXYNOT FINANCIAL ADVICE
I've yet to see this being mentioned anywhere on the internet, but TVC:DXY 's rally may just be CRYPTOCAP:BTC 's best friend.
This, despite the popular notion that when TSX:DXT goes up, CRYPTOCAP:BTC goes down, and vice-versa.
However, this novel idea puts a break to it.
TVC:DXY is hitting the bottoms of its uptrending channel, and it's likely to bounce back up towards the ceilings.
Which means a rally is likely, and this is kinda good for $BTC.
I'll remain bullish, until the numbers say otherwise.
Dollar indexDollar index in deep discount
Looking for higher prices this month
This my idea not a signal
#ICT
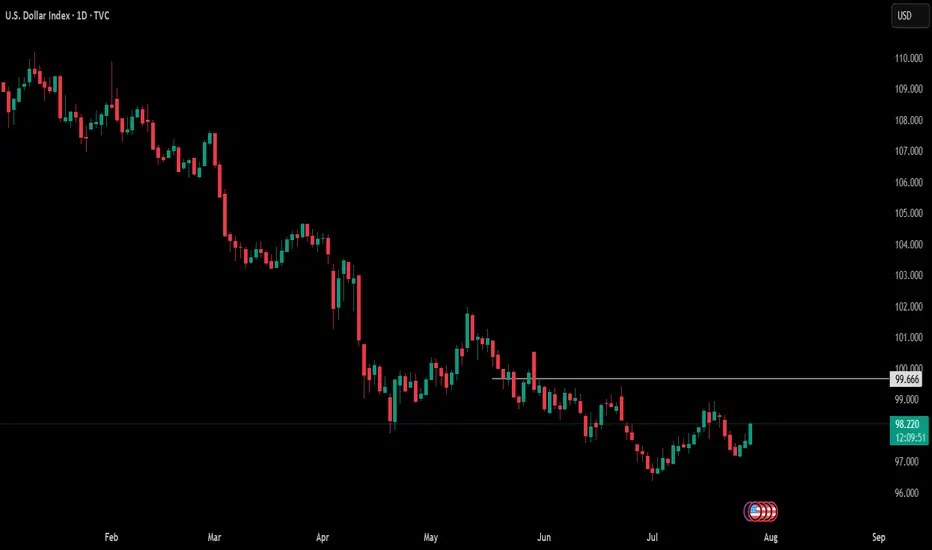
US Dollar Index - 4h Chart (CAPITALCOM)4-hour chart of the US Dollar Index (DXY) from CAPITALCOM shows the index's recent price movements. The current value is 96.955, with a slight increase of 0.054 (+0.06%). Key levels include a support at 96.413 and resistance at 97.554. The chart highlights buy signals at 97.012 and sell signals at 96.958 and 96.955, with a notable downward trend breaking below a support zone around 97.150.

DXY DAILYI see the dollar index trend still bearish
Of course, this is on a daily time frame!
In this event, the value of stock indices (Dow Jones, etc.) will increase
It will also have a direct impact on major pairs
I hope you are successful in your trading😊

DXYThe latest COT data shows net short positions increasing on the U.S. Dollar, indicating a bearish sentiment from institutional traders. A rising short bias suggests weakening confidence in the dollar’s strength across major currencies.

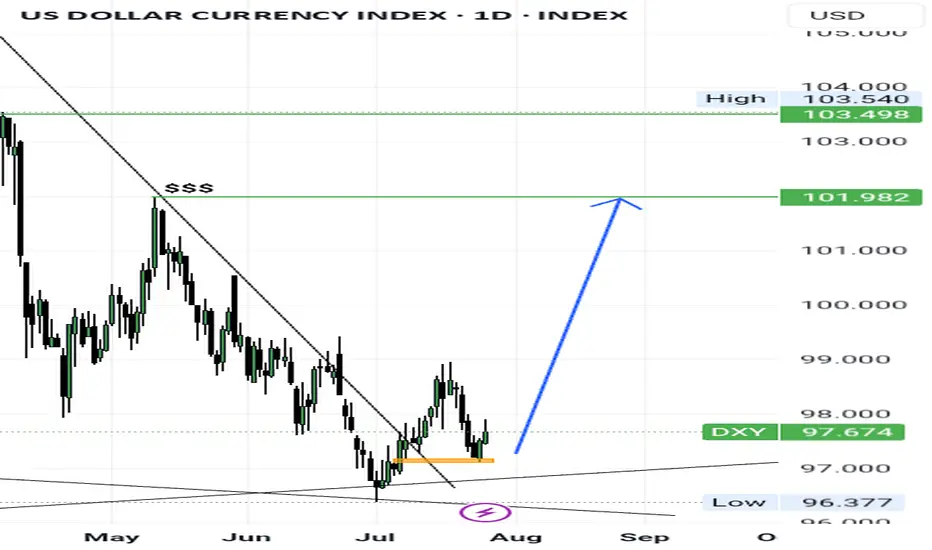
Dollar Index (DXY): Time to Recover
It looks like Dollar Index is going to recover after a yesterday's
rapid fall.
The market reached a key support and formed a cup & handle pattern on that.
We can expect a pullback at least to 98.09 level.
❤️Please, support my work with like, thank you!❤️

Dollar Index Holds Below 98 as Markets Await Trade Deal ProgressThe dollar index remained below 98 today, extending its two-day decline as investors watched trade negotiations ahead of the August 1 deadline. Treasury Secretary Scott Bessent said deal quality is the priority, suggesting Trump could grant extensions to countries showing real progress.
Markets are also focused on Fed Chair Powell’s speech for signals on interest rates. Despite Trump’s push for a cut, traders are not expecting action this month.
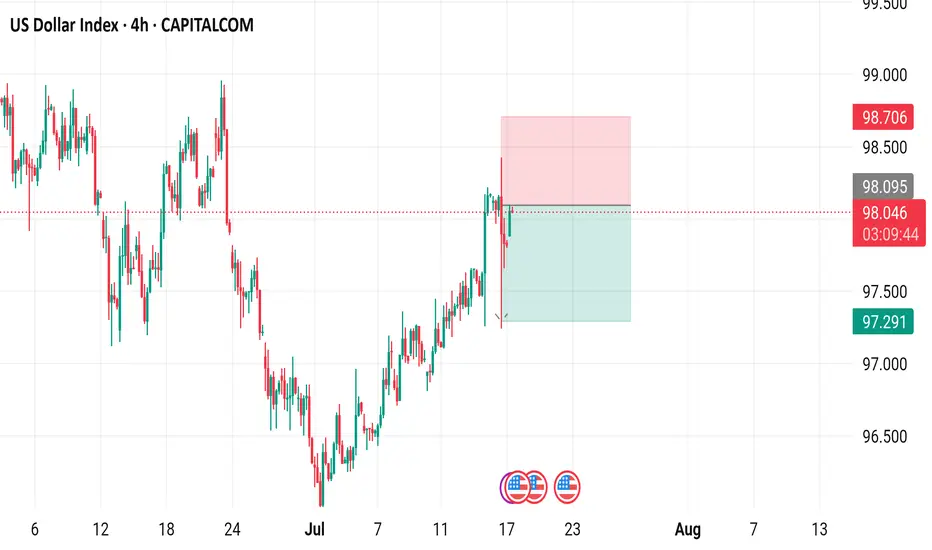
US Dollar Index (DXY) - 4 Hour Chart4-hour performance of the US Dollar Index (DXY) from CAPITALCOM, showing a current value of 98.040 with a 0.23% increase (+0.222). The chart includes recent buy and sell signals at 98.094 and 98.040, respectively, with a highlighted resistance zone around 98.706-99.000 and a support zone around 97.291-98.040. The timeframe covers data from early July to mid-August 2025.
what ifdxy view i just want to leave there for my lulz and see what happens in a couple years so i can lol at myself yet again

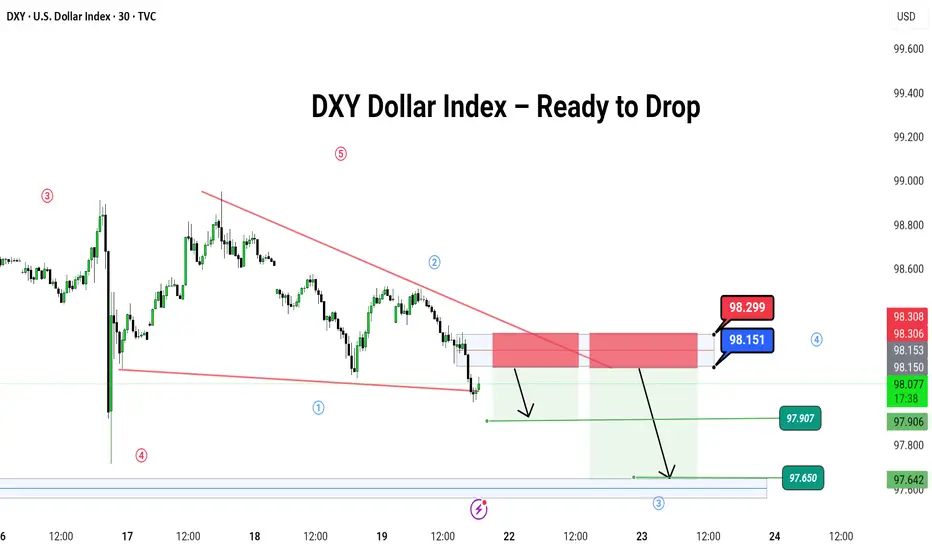
DXY Dollar Index – Ready to Drop
🌪️ DXY Dollar Index – Ready to Drop Like a Hot Potato? 💸
Hey traders! 🎯
The DXY (U.S. Dollar Index) is dancing inside a falling wedge 🔻, and it just hit the top of the party zone (red box 🎁).
📍 We're watching for a bounce up to this red zone near 98.151–98.299, then expecting a big slide down like a rollercoaster 🎢 toward:
🎯 Target 1: 97.907
🎯 Target 2: 97.650
🛑 Stop if it jumps over: 98.299
🌀 Pattern: Ending Diagonal / Wave 5 Setup
🧠 Logic: Smart money might be setting up the final wave before a major fall. Let it pop, then drop!
💡 It’s like the last spark before the fireworks go out 🎆
---
#DXY #USDIndex #ForexTrading #Wave5 #PriceAction #ChartPattern #SimpleTrading #DollarDrop
---
Let me know if you have ant suggestion ,
DXYThe current COT data shows a bullish bias for the U.S. Dollar, with institutional traders positioning net long. Although DXY is moving sideways, this positioning suggests a likely continuation of USD strength. If price breaks above key resistance levels, it would confirm the bullish sentiment reflected in the COT report.

Correction As long as the indicator does not stabilize above the green resistance area, there is a possibility of a trend change and the start of a downtrend.

Dollar $DXY Bullish WedgePretty clean falling wedge with divergence. Aligns with a pullback to come on BTC and Stocks.
A move back to 104 area would do some damage to risk on assets.
Follow for updates.
Bearish drop off 50% Fibonacci resistance?The US Dollar Index (DXY) is rising towards the pivot which acts as a pullback resistance and could drop to the 1st support.
Pivot: 99..15
1st Support: 96.54
1st Resistance: 100.57
Risk Warning:
Trading Forex and CFDs carries a high level of risk to your capital and you should only trade with money you can afford to lose. Trading Forex and CFDs may not be suitable for all investors, so please ensure that you fully understand the risks involved and seek independent advice if necessary.
Disclaimer:
The above opinions given constitute general market commentary, and do not constitute the opinion or advice of IC Markets or any form of personal or investment advice.
Any opinions, news, research, analyses, prices, other information, or links to third-party sites contained on this website are provided on an "as-is" basis, are intended only to be informative, is not an advice nor a recommendation, nor research, or a record of our trading prices, or an offer of, or solicitation for a transaction in any financial instrument and thus should not be treated as such. The information provided does not involve any specific investment objectives, financial situation and needs of any specific person who may receive it. Please be aware, that past performance is not a reliable indicator of future performance and/or results. Past Performance or Forward-looking scenarios based upon the reasonable beliefs of the third-party provider are not a guarantee of future performance. Actual results may differ materially from those anticipated in forward-looking or past performance statements. IC Markets makes no representation or warranty and assumes no liability as to the accuracy or completeness of the information provided, nor any loss arising from any investment based on a recommendation, forecast or any information supplied by any third-party.

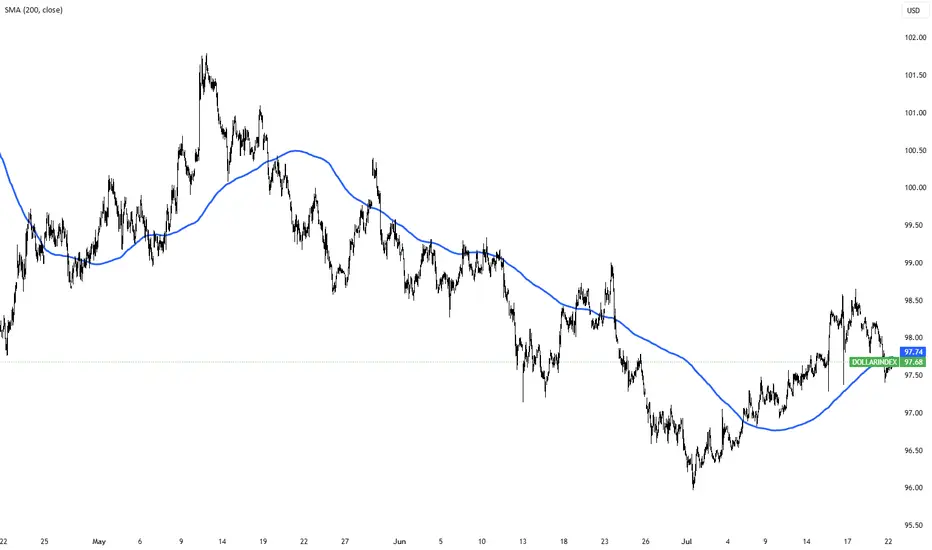
DXY Eyes Breakout – Dollar Strength Gaining GroundThe U.S. Dollar Index (DXY) is testing its 50-day moving average on the daily chart, with bulls eyeing a potential breakout. A move above 98.75 could confirm a short-term trend reversal and open the path for further gains.
Stronger-than-expected U.S. economic data continues to support the greenback. Recent inflation prints, job market resilience, and solid retail spending have pushed back expectations for imminent Fed rate cuts. This shift in rate outlook provides fundamental support for the dollar.
In addition, strong U.S. corporate earnings are bolstering equity markets, attracting capital flows into U.S. assets and indirectly supporting dollar demand. Rising Treasury yields, especially on the short end, also offer more attractive returns for dollar-based investments.
Geopolitical uncertainties and trade tensions in Asia and Europe are prompting a rotation into the dollar as a safe-haven currency.
Meanwhile, some emerging market currencies are under pressure, increasing global demand for dollar liquidity.
Technically, a close above 98.75 could confirm bullish momentum, with 99.80 as the next upside target. As long as macro and risk dynamics lean in the dollar’s favor, DXY may continue its rebound from recent lows.
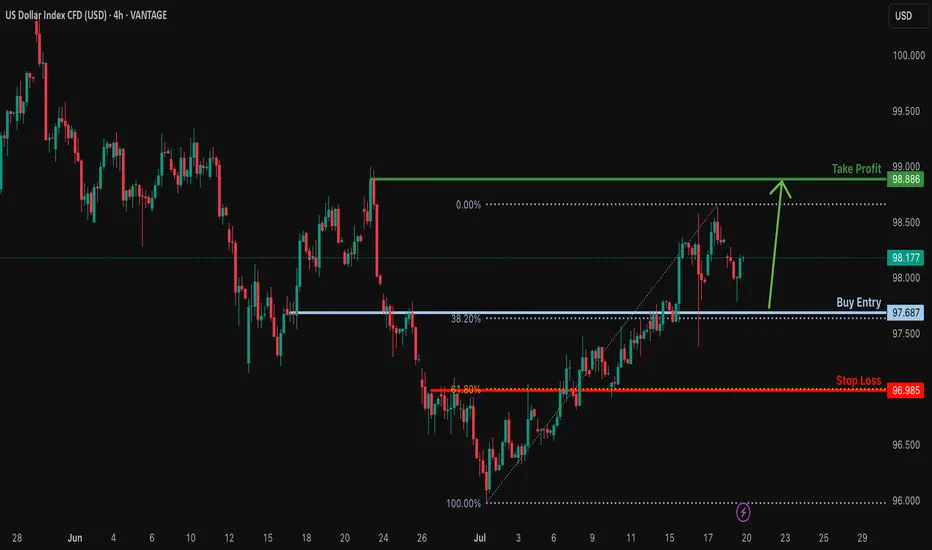
Bullish continuation for the Dollar?The price is falling towards the support level which is a pullback support that lines up with the 38.2% Fibonacci retracement and could bounce from this level to our take profit.
Entry: 97.68
Why we like it:
There is a pullback support that aligns with the 38.6% Fibonacci retracement.
Stop loss: 96.98
Why we lik eit:
There is an overlap support that aligns with the 61.8% Fibonacci retracement.
Take profit: 98.88
Why we like it:
There is a pullback resistance.
Enjoying your TradingView experience? Review us!
Please be advised that the information presented on TradingView is provided to Vantage (‘Vantage Global Limited’, ‘we’) by a third-party provider (‘Everest Fortune Group’). Please be reminded that you are solely responsible for the trading decisions on your account. There is a very high degree of risk involved in trading. Any information and/or content is intended entirely for research, educational and informational purposes only and does not constitute investment or consultation advice or investment strategy. The information is not tailored to the investment needs of any specific person and therefore does not involve a consideration of any of the investment objectives, financial situation or needs of any viewer that may receive it. Kindly also note that past performance is not a reliable indicator of future results. Actual results may differ materially from those anticipated in forward-looking or past performance statements. We assume no liability as to the accuracy or completeness of any of the information and/or content provided herein and the Company cannot be held responsible for any omission, mistake nor for any loss or damage including without limitation to any loss of profit which may arise from reliance on any information supplied by Everest Fortune Group.
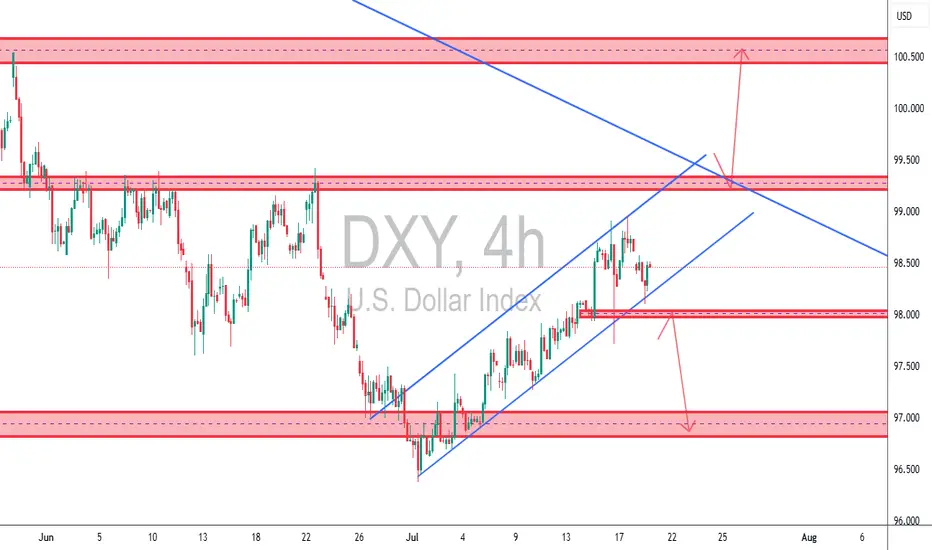
TCB Strategy Application on DXY 4H✅ TCB Strategy Application on DXY 4H
🔹 Trend → Countertrend → Breakout Structure:
• Trend: We’ve had a bullish recovery from the 97.00 zone (bottom demand), moving within an ascending channel.
• Countertrend Zone: Price has now pulled back from the 99.00–99.200 supply area.
• Breakout Watch:
o A break below the ascending channel (support line) + 98.00 zone would signal countertrend breakout → opens potential for 97.000 retest.
o A break above 99.200 would be a bullish breakout targeting the 100.500–101.000 macro supply zone.
________________________________________
🔄 What This Means for Dollar Pairs (Especially XAUUSD):
🟥 Scenario 1: Bearish DXY Breakout (98.00 loss)
• Expect XAUUSD bullish continuation, possibly reclaiming upside zones (especially if DXY targets 97.00).
• GBPUSD, EURUSD, etc., likely to gain against USD.
🟩 Scenario 2: Bullish DXY Breakout (Above 99.200)
• XAUUSD may reject from resistance or fall back toward support zones.
• USD strength will put pressure on GBPUSD, EURUSD, and other majors.
________________________________________
🧠 TCB Notes:
• Checklist Score (Pre-Breakout): ~75%
o ✔ Structure zones marked
o ✔ Channel support tested
o ✔ Reaction to supply zone
o ✖ Awaiting breakout candle + NY session confirmation
________________________________________
🔔 Suggested Alerts (Set in TradingView):
• DXY Breakout Alert: 98.00 (bearish trigger)
• DXY Bullish Trigger Alert: 99.20 or trendline breakout
• Match these alerts with corresponding TCB setups on XAUUSD, GBPUSD, etc.
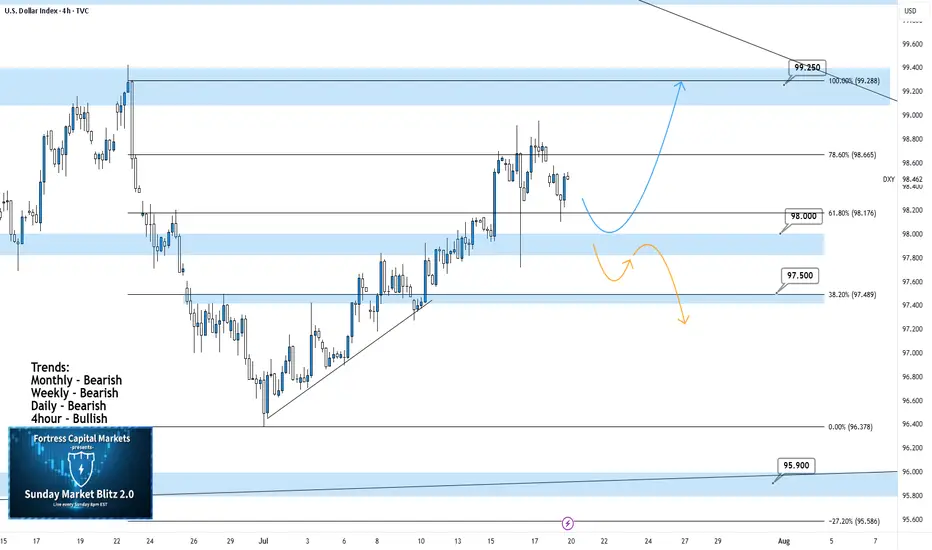
DXY 4Hour TF - July 20th, 2025DXY 7/20/2025
DXY 4hour Neutral Idea
Monthly - Bearish
Weekly - Bearish
Dailly - Bearish
4hour - Bullish
Higher timeframe trend analysis suggests that DXY is primarily bearish and is currently retracing to potential resistance.
Going into this week we are looking to see if our 98.000 zone will stay as support or transition into resistance. Here are two scenarios which highlight both a bullish and bearish outcome:
Bullish Continuation - Last week we saw a strong rally through our 98.000 zone which seems to still be holding. If this 4hour bullish trend is to continue we would like to see some sort of rejection off 98.000 support while also confirming a higher low. If this happens look to target higher toward major resistance levels like 99.250.
Bearish Reversal- If we are to consider DXY bearish again on the 4hour we would need to see a break below 98.000 support and confirm this level as new resistance.
There are a few major support levels to watch out for but DXY has the potential to fall dramatically if we see price get below 97.500.
$DXY🧠 What if the U.S. is intentionally slowing down the economy to weaken the dollar…
Letting the Chinese yuan strengthen so China is forced to shift from exports to consumption?
A stronger yuan means China imports more.
That’s a win for U.S. companies ready to sell.
DXY is on real powerful uptrend!hi all. for who wants to know the Long Term Direction of the market, DXY is the key. market end the retrace leg and will jump up. As you see the Tariffs effect Started and in quote of President Trump, MAGA. be happy and have a powerful trade (wink)
