Electronic Arts: Jump!Recently, EA has made a strong upward jump, coming very close to the significant resistance at $169.82. However, the price quickly fell again, providing us with sufficient confirmation to consider the magenta wave (2) as completed. The current wave (3) should extend below the support at $114.60, and
Electronic Arts: A Leader in the Gaming IndustryElectronic Arts (EA) is a renowned game developer and publisher that's been around since 1982. Founded by William M. Hawkins III and William Gordon, the company has grown to become a major player in the gaming industry.
**What does EA do?**
* Develops and publishes games across various genres, inc
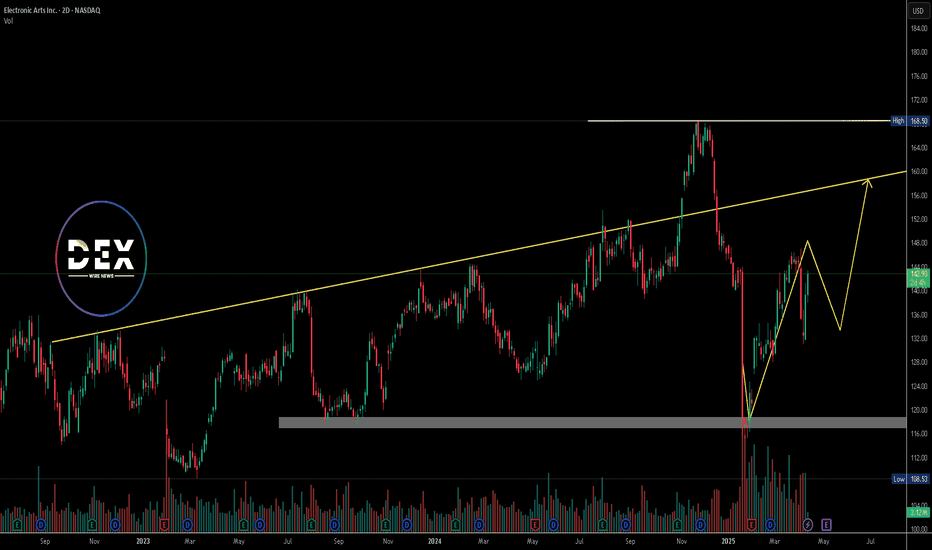
Electronic Arts Inc. Stock Sees Momentum Ahead of Earnings Electronic Arts Inc. (NASDAQ: NASDAQ:EA ) is gaining attention as the gaming industry shows signs of recovery. The stock closed at $142.93 on April 11, 2025, reflecting a gain of $3.54( 2.54%) for the day. Its next earnings report is scheduled for May 6, 2025.
The gaming industry grew rapidly durin
A Market Teetering on the Edge: Is EA Poised for a Rebound?With NASDAQ-EA trading at $118.70, down nearly 30% from its all-time high of $168.50 just 63 days ago, the market presents a mix of caution and intrigue. RSI levels languish deep in oversold territory, with daily RSI14 at an eye-popping 12.19—signaling potential exhaustion in bearish momentum. Add t
Electronic Arts: Heading DownwardWe assume that EA’s recent high at $169.82 marked the completion of a prominent wave in green. This top stands out because it represents a typical corrective pattern where a seemingly new uptrend is simulated. Unlike a standard B wave, an overshooting B wave can significantly exceed the prior peak
Electronic Arts Inc. (EA) 20% upPrice Target Analysis:
Key Levels:
Primary Target: $176.83 (1.0 Fibonacci Extension) with a 75% probability.
Extended Target: $196.46 (1.618 Fibonacci Extension) with a 60% probability.
Support Zones:
Immediate support at $145.06 (0.459 Fibonacci).
Critical support at $138.38 (key invalidation lev
Electronic Arts Inc. | Chart & Forecast SummaryKey Indicators on Trade Set Up in General
1. Push Set Up
2. Range Set up
3. Break & Retest Set Up
Active Sessions on Relevant Range & Elemented Probabilities;
* Asian(Ranging) - London(Upwards) - NYC(Downwards)
* Weekend Crypto Session
# Trend | Time Frame Conductive | Weekly Time Frame
- General
See all ideas
Displays a symbol's price movements over previous years to identify recurring trends.
Curated watchlists where EA is featured.


