GOOG trade ideas

GOOG LEVELS ENDING MARCHGOOG levels 3/25/25
FIb is clean?
is now a buy? When it dips below fib area is that major buy? or major WAIT ?

GOOGL Facing Major Reversal Zone! Decision Time Approaching!Here's a straightforward breakdown of GOOGL based on the 1-hour chart and GEX insights:
📈 Technical Analysis (TA):
* GOOGL currently hovering within a critical green reversal zone around $167–$168, showing possible bullish exhaustion.
* Recent Break of Structure (BOS) indicates bullish sentiment, but price action within this green reversal zone is critical.
* A strong red reversal zone at $157–$160 indicates robust support below, confirmed by a significant Change of Character (CHoCh).
* Watch closely how GOOGL behaves in the current zone. Any rejection could quickly see a retracement.
📊 GEX & Options Insights:
* Highest positive NET GEX and critical CALL resistance clearly marked at the $170 level, a significant gamma magnet.
* Strong PUT support positioned firmly at $160, aligning closely with the red reversal zone. Essential for downside protection.
* IV Rank moderate at 31.4%, suitable for either debit or credit spread strategies.
* CALL sentiment low at 9.8%, indicating cautiously optimistic sentiment but alertness at reversal zones.
💡 Trade Recommendations:
* Bullish Scenario: On a solid breakout above $168, target the $170 gamma resistance using calls. Maintain tight stops around $165.
* Bearish Scenario: Monitor for rejection signs in the green reversal zone; consider puts targeting lower support at $160.
* Neutral Approach: Given moderate IV, consider balanced credit spreads or Iron Condors between clear support/resistance ($160–$170).
🛑 Risk Management: Always adhere to disciplined risk management, especially near pivotal reversal zones.
Stay alert and trade wisely!
Disclaimer: This analysis is for educational purposes only and does not constitute financial advice. Always do your own research and manage your risk before trading.

GOOGL, Short, 1D✅ GOOGL broke the key support at 166.25, confirming bearish momentum. The price is expected to decline further toward the next key support at 149.50.
SHORT 📉
✅ Like and subscribe to never miss a new analysis! ✅

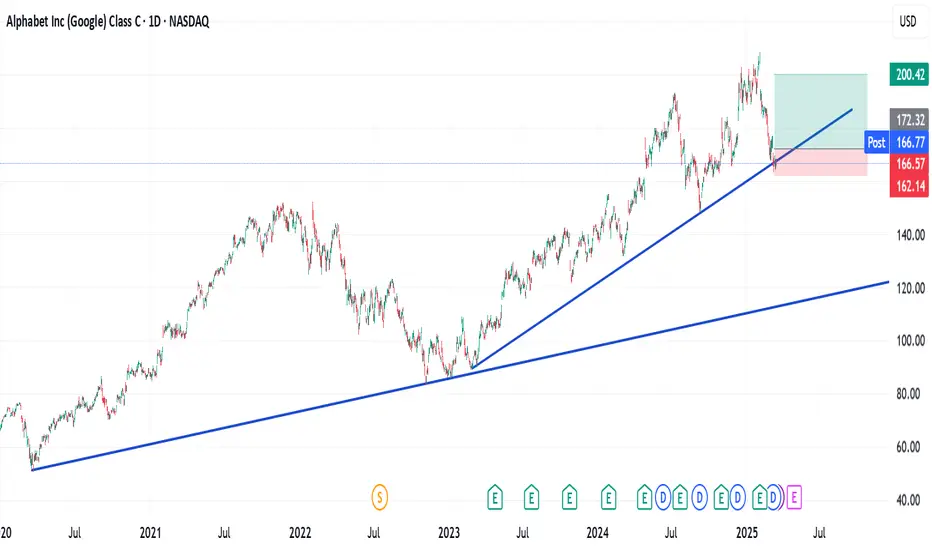
$GOOGL $GOOG - I would wait.NASDAQ:GOOGL and NASDAQ:GOOG had a promising cup-and-handle setup, but the earnings report (ER) disrupted it. The stock is currently below the uptrend line.
I would wait for the $143 to $140 area to position for a potential bounce.
For the first time in its history, Google’s search business faces serious threats, putting its technological leadership in question.

Google -GOOG at a critical junctureGoogle -GOOG at a critical juncture
If this asset breaks above the trendline sustainably, I will expect this asset to push further to the north.
The TL will become support level and my SL will be below the TL as shown on my chart.
Trade with care
GOOGL ON SUPPORT: 23% BOUNCE IMMINENTNASDAQ:GOOGL GOOGL has consolidated significantly over the last few weeks and, like the NASDAQ, has also taken a beating. Due to the now attractive valuation, the continued stable growth and earnings growth, GOOGL is still a good investment.
Technically, we have reached a trend line and a weaker horizontal support with a further support area at around USD 150. We are already seeing the first RSI divergence. The Bollinger Bands (not shown in the chart, otherwise it would be confusing) are also far overstretched and make a bounce likely. There is also an open gap at $192 - $203.
I would open about 50% of the actual trading position now and the rest when the price falls into the green box, which I still consider to be a possible consolidation area. If the price turns immediately, we are still in with half.
Target Zones:
$192.00
$205.00
Support Zones:
$165.00
$150.00

Is GOOGL Setting Up for a Rebound?The corrective move continues, offering potential opportunities for strategic entries. If the dip extends, these key levels could present buying opportunities:
📉 Entry Points:
🔹 165
🔹 158
🔹 150
🔹 135-130 ⚠️ Possible deeper entry point???
📈 Profit Targets:
🔹 175
🔹 181
🔹 190
Will GOOGL find support at these levels and bounce back, or is there more downside ahead? Stay prepared and manage your risk wisely.
Disclaimer: The information provided is for educational purposes only and does not constitute investment advice. Trading involves significant risks, and past performance is not indicative of future results. Always conduct your own analysis and consult a financial advisor before making any investment decisions.

$GOOG Growth PotentialGrowth Potential
Given the current price of $166.11, reaching the target of $190.12 implies a potential upside of approximately 14.5%. Considering Alphabet's strong financial performance, positive analyst projections, and ongoing innovations in areas like quantum computing and autonomous vehicles, the stock appears well-positioned for future growth.


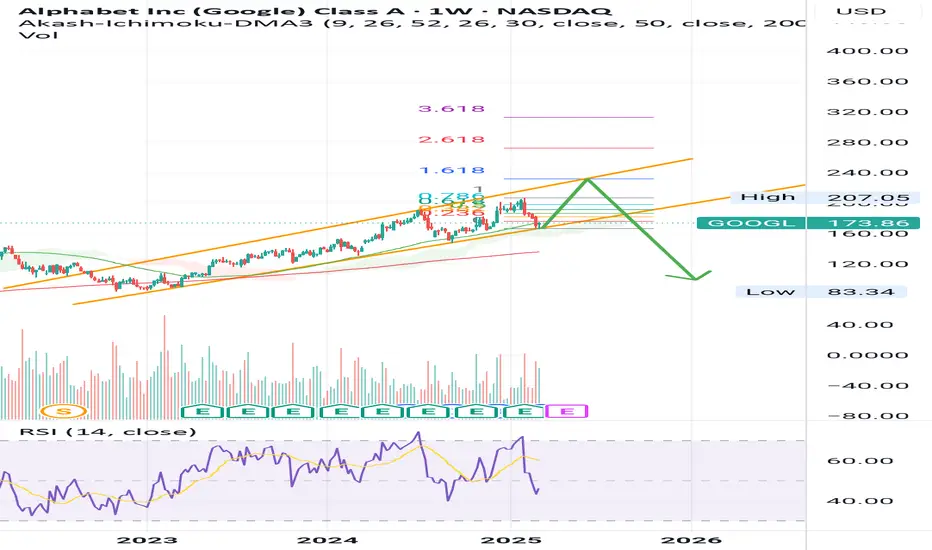
Alphabet Stock (GOOGL): Bounce Incoming?There is growing potential that a major price top has formed, particularly after the break below the November low, which has increased the probability of this scenario. The move down from the February high appears to be a three-wave structure, and I am watching for a bounce from the current region. However, this could simply be a B-wave in the yellow scenario, setting up for much lower prices.
At this stage, it's too early to confirm a major top with certainty. The structure of the next rally will provide crucial insights. The current downward move is not yet a clear five-wave decline, leaving the door open for higher prices in the white scenario. However, even that becomes increasingly unlikely with a break below $157.50.
For now, the working thesis is that a major top has formed, but confirmation of new highs would only come with a break above $196.69. In the short term, the price should ideally react to the current region, but we need to see a break above $173 (closing the last gap) to indicate a local low is in place. If that happens, we could be in a B-wave, which would likely target the $183 to $196 zone before the next major decision point.

GOOGL upside potentialTechnicals
GOOGL has yet to close below a major trendline, indicating potential continuation of the uptrend.
Fair Value Gap (FVG) Target: There is an inefficiency in price that could act as a magnet for an upward move. If buyers step in at support, the next target will be filling this gap.
Fundamentals
Revenue Growth: Q4 2024 revenue came in at $96.5 billion (+12% YoY), driven by strength in Search, YouTube Ads, and Google Cloud.
AI Investments: Alphabet plans to invest $75 billion in AI infrastructure this year, boosting its competitive edge.
Profitability: Operating income rose 33% YoY, with improving margins (32%).
Market Rotation: Strong institutional interest in mega-cap tech stocks supports potential upside.

The only tech stock I’d consider buying right nowThis analysis is provided by Eden Bradfeld at BlackBull Research.
We’ve seen the S&P, NASDAQ and every other American index get slammed in the last couple of days. Some people are panicking. A lot of people are panicking. If you go on Twitter (sorry — X dot com) you will find a lot of people who listened to a recommendation from a guy on YouTube about a trash stock like say, IonQ or HIMS, and are now fairly upset said YouTube guy (or Twitch guy, or whatever) got it wrong.
Frankly, a correction is a healthy thing because it allows investors to purchase good companies at more reasonable multiples.
I have no idea where the market goes from here. I can’t see the future. I admit this sell-off has me adding tech stocks (and other American stocks) to my watch-list, and I’ll continue to monitor them.
A lot of tech stocks — the bulk of what has fallen as of late — still aren’t in that zone for me yet. Amazon still trades at a current multiple of 35x earnings and a fwd multiple of 28x — I can’t find much value in that, especially when I consider that Google, a company with +$83 billion in net profit and a 32% operating margin, can be acquired for 16x fwd earnings (I had to check those numbers too just to be sure — when you’ve still got things like Palantir trading “to the moon” (and back), 16x⁴ seems like a reasonable price for the dominant advertising platform in the world).
Here’s Buffett, in his 2008 essay — Buy American, I am:
A simple rule dictates my buying: Be fearful when others are greedy, and be greedy when others are fearful. And most certainly, fear is now widespread, gripping even seasoned investors. To be sure, investors are right to be wary of highly leveraged entities or businesses in weak competitive positions. But fears regarding the long-term prosperity of the nation’s many sound companies make no sense. These businesses will indeed suffer earnings hiccups, as they always have. But most major companies will be setting new profit records 5, 10 and 20 years from now.
Buffett was right, of course. If you purchased stocks in 2008 and held them you would’ve done pretty well (as long as you didn’t buy Lehman Brothers!). The GFC saw stocks fall 48% from their peak — if we are indeed heading towards that territory there is more room to fall. I have no idea — examining the basket of tech stocks I look at, the only one that presents any value is Google. It’s reasonable at 16x fwd earnings. If it traded at 12x earnings, it would be a bargain - in my opinion. How low can you go?


SP500 Weekly Action Areas & Price Targets 10/03/25In this update, we review the recent price action in the emini S&P 500 futures contract and identify high-probability action areas and price targets for the trading week ahead. To review today's video, click here!

Massive bearish pendant Mag 7 is littered with bearish patterns. This one has massive bearish rising wedge 4hr chart. Be cautious and again this is off my opinion and analysis.

GOOGL - Melt up & Crash series [1] GOOGL has a date with the top rail around very late may or early June in my opinion.
Again it has already touched the green ichimoku cloud once, it only needs to complete the channel.
Not financial advice.
GOOGLE Stock Chart Fibonacci Analysys 030825Trading Idea
1) Find a FIBO slingshot
2) Check FIBO 61.80% level
3) Entry Point > 170/61.80%
Chart time frame: B
A) 15 min(1W-3M)
B) 1 hr(3M-6M)
C) 4 hr(6M-1year)
D) 1 day(1-3years)
Stock progress: A
A) Keep rising over 61.80% resistance
B) 61.80% resistance
C) 61.80% support
D) Hit the bottom
E) Hit the top
Stocks rise as they rise from support and fall from resistance. Our goal is to find a low support point and enter. It can be referred to as buying at the pullback point. The pullback point can be found with a Fibonacci extension of 61.80%. This is a step to find entry level. 1) Find a triangle (Fibonacci Speed Fan Line) that connects the high (resistance) and low (support) points of the stock in progress, where it is continuously expressed as a Slingshot, 2) and create a Fibonacci extension level for the first rising wave from the start point of slingshot pattern.
When the current price goes over 61.80% level , that can be a good entry point, especially if the SMA 100 and 200 curves are gathered together at 61.80%, it is a very good entry point.
As a great help, tradingview provides these Fibonacci speed fan lines and extension levels with ease. So if you use the Fibonacci fan line, the extension level, and the SMA 100/200 curve well, you can find an entry point for the stock market. At least you have to enter at this low point to avoid trading failure, and if you are skilled at entering this low point, with fibonacci6180 technique, your reading skill to chart will be greatly improved.
If you want to do day trading, please set the time frame to 5 minutes or 15 minutes, and you will see many of the low point of rising stocks.
If want to prefer long term range trading, you can set the time frame to 1 hr or 1 day.

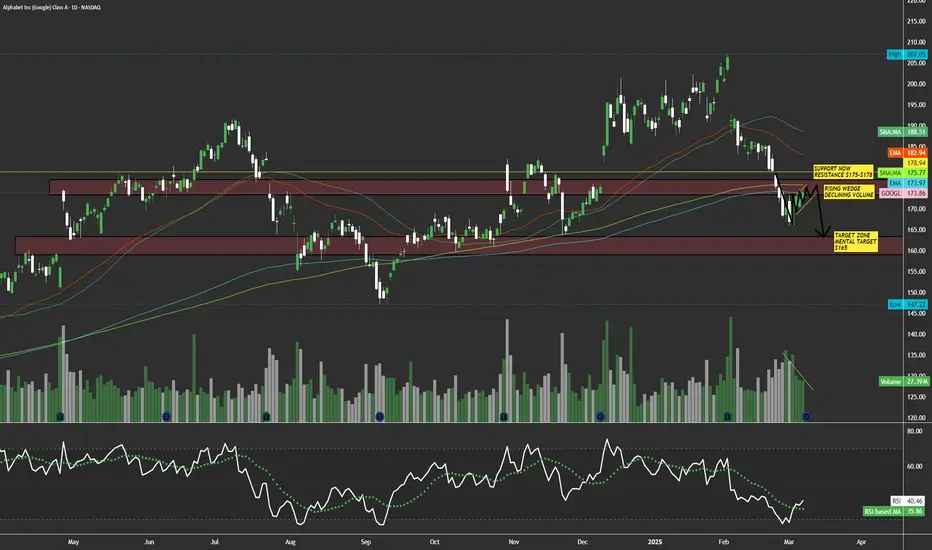
$GOOGL Rising bearish wedge with declining volume; $165 belowNASDAQ:GOOGL here looks weak to me trying to reclaim it's support of $175-$180. This is on my watchlist for a short term short, if this name tanks back into the $150's I will load everything I got for the long side. I see this name in a downside trend currently in a rising wedge with declining volume, buyers can't hold it up much longer. It's retested that support on 3 or more daily candles and hasn't busted through. I expect this name to drop into a support zone of $160-$165. I will look to enter puts off a retest of $176-$178 area keeping the stops tight.
WSL.
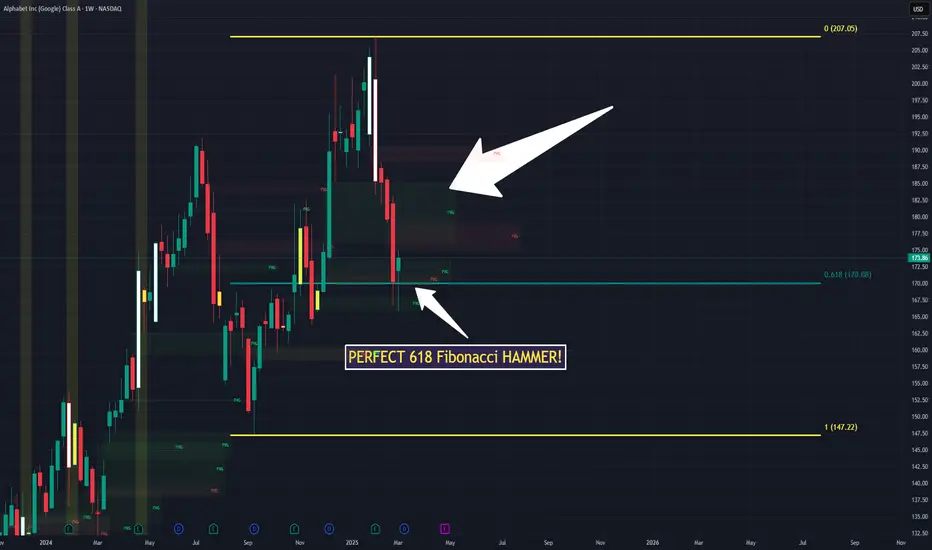
$GOOGL RELATIVE Strength ONCE IN A LIFETIME Pelosi STYLETarget 190🎯
GOOGLE HELD strong during this crash on the 618 AND refuses to go lower
I am going in HARD selling puts and BUYING leaps all will be given here
JUST drop a HEART FAST!
Google (Alphabet) is at a critical levelGoogle just touched POC of 2024 based on Volume profile as well as a long term trend line.
It is a screaming buy on its own. If POC level is broken then it would mean market is going in deeper correction. For now I think it is bullish unless macro economics confirms R

GOOGLE Stock Chart Fibonacci Analysis 030625Trading Idea
1) Find a FIBO slingshot
2) Check FIBO 61.80% level
3) Entry Point > 180/61.80%
Chart time frame: B
A) 15 min(1W-3M)
B) 1 hr(3M-6M)
C) 4 hr(6M-1year)
D) 1 day(1-3years)
Stock progress: B
A) Keep rising over 61.80% resistance
B) 61.80% resistance
C) 61.80% support
D) Hit the bottom
E) Hit the top
Stocks rise as they rise from support and fall from resistance. Our goal is to find a low support point and enter. It can be referred to as buying at the pullback point. The pullback point can be found with a Fibonacci extension of 61.80%. This is a step to find entry level. 1) Find a triangle (Fibonacci Speed Fan Line) that connects the high (resistance) and low (support) points of the stock in progress, where it is continuously expressed as a Slingshot, 2) and create a Fibonacci extension level for the first rising wave from the start point of slingshot pattern.
When the current price goes over 61.80% level , that can be a good entry point, especially if the SMA 100 and 200 curves are gathered together at 61.80%, it is a very good entry point.
As a great help, tradingview provides these Fibonacci speed fan lines and extension levels with ease. So if you use the Fibonacci fan line, the extension level, and the SMA 100/200 curve well, you can find an entry point for the stock market. At least you have to enter at this low point to avoid trading failure, and if you are skilled at entering this low point, with fibonacci6180 technique, your reading skill to chart will be greatly improved.
If you want to do day trading, please set the time frame to 5 minutes or 15 minutes, and you will see many of the low point of rising stocks.
If want to prefer long term range trading, you can set the time frame to 1 hr or 1 day.

Google to Shoot Up. GOOGABC ZigZag complete. We retraced an upward move, to bounce off a recent low of lows. VZO, Stochastic threw off signals, US and VZO are supportive now. The bullish candle crossed 0-B zigzag line. Good luck and don't lose capital.
