Helmerich & Payne | Chart & Forecast SummaryKey Indicators On Trade Set Up In General
1. Push Set Up
2. Range Set up
3. Break & Retest Set Up
Notes On Session
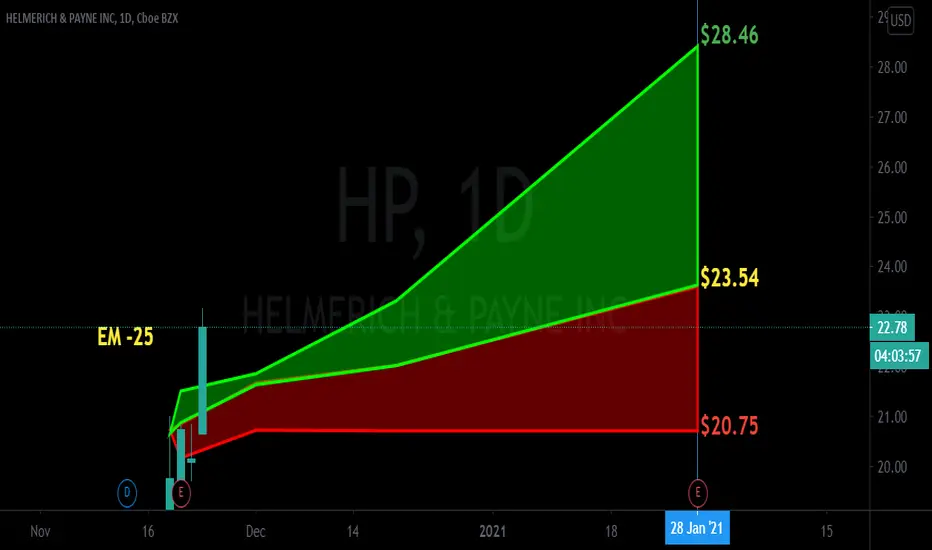
# Helmerich & Payne
- Double Formation
* Retracement | 1)) & 0.618)) | Downtrend Bias
* Trend Line | Survey | Channel Mark Up
- Triple Formation
* Flag Structure | 39.50 USD | Configuration | Subdivision 1
* Top / Bottom Structure | 33.60 USD | Neckline Condition | Subdivision 2
* Retracement (2) , 0.382)) & (0)) | Daily Time Frame | Subdivision 3
Active Sessions On Relevant Range & Elemented Probabilities;
London(Upwards) - NYC(Downwards)
Conclusion | Trade Plan Execution & Risk Management On Demand;
Overall Consensus | Neutral
HP trade ideas

HP tradebottom of regression trend. Good probability of coming back to middle, maybe even the top.
Helmerich & Payne, Inc. is an American petroleum contract drilling company engaged in oil and gas well drilling and related services for exploration and production companies headquartered in Tulsa, Oklahoma, with operations throughout the world.

Slight Possibility on HP weekly HP has fell through its previous support, but it is resting on a Demand area with a long wick candle on weekly upward trendline, so slight possibility of reversal

Helmerich and Payne Inc | Chart & Forecast SummaryKey Indicators on Trade Set Up in General
1. Push Set Up
2. Range Set up
3. Break & Retest Set Up
Active Sessions on Relevant Range & Elemented Probabilities;
* Asian(Ranging) - London(Upwards) - NYC(Downwards)
* Weekend Crypto Session
Trend |Time Frame Conductive | Daily Time Frame
- General Trend
- Measurement on Session
- Signpost
* Support & Resistance
* Trade Area | Focus & Motion Ahead
# Position & Risk Reward | 15 Minutes Time Frame
- Measurement on Session
* Retracement | 0.5 & 0.618
* Extension | 0.88 & 1
Conclusion | Trade Plan Execution & Risk Management on Demand;
Overall Consensus | Buy

HP (Energy | Oil & Gas Drilling) LONGHP | Helmerich & Payne, Inc.
Energy | Oil & Gas Drilling | USA | NYSE
HP chart in may-june 2023 finished its 4th wave.
I expect $54 price till the end of the year - the 1st wave of the big 5th wave.

HP HP better known as Helmerichh & payne earnings are tomorrow not looking for a big move they been trading sideways for a while now i don't foresee a breakout coming anytime soon but that is not a bad thing with a stock that pay dividends

$HP (Helmerich & Payne Inc): Price Action & Technical Analysis"The experience of the past leaves little doubt that every economic system must sooner or later rely upon some form of the profit motive to stir individuals and groups to productivity. Substitutes like slavery, police supervision, or ideological enthusiasm proof too unproductive, too expensive, or too transient."
Will Durant
The financial markets! Those deep and dodgy black boxes forums where dark magic comes to life and where savvy traders sell their souls in exchange for a profit (well in exchange for the opportunity to make a profit).
We're so indoctrinated to deem these tenacious operators as an incarnation of the devil that we fail to remember how ancient and unstoppable this inclination to speculate has been.
Don't ask me to articulate any further, but speculation has been so embedded in the history of civilization that it strikes me as natural decurrence from our nature as human beings.
It has been propelled by optimism about the future - otherwise why would you sacrifice or put at risk the assets you have now? The same optimism that has bounded us to achieve unimaginable things that you and I give for granted.
... and, now strictly in line with the quote I brought you today, it has endured through a whole bunch of alternatives ... which are ... not alternatives to say the least. Just like history has demonstrated over and over.
Next time you hear your leaders ditching on these evil figures ... think twice before nodding in agreement.
In line with our usual work, on the price action side, today I brought you $HP.
LINK IN BIO for full analysis.
Enjoy and indulge!

HO, tight stopBOUGHT 1/4 position pull back buy.
120@66.75 --> 1.5% position. Overall exposure now @32.8%
Stop 62.15
Risk:6.9%
Shippers are holding nicely and look like they want to go higher. Opportunity here to start a position.

HP - Double Bottom Leading To ContinuationThe main up trend line has been breached and a double bottom formation has initiated the recovery
Right now is a good entry below this trend line as it has held for ages

Industry comparison: Clothing diversifiedComparing the top brand performance in apparel retail, manufacturing, footwear and department stores


HP Retest Resistance Overview:
SPN pulls ahead of other SP500 categories for YTD returns
HP performing quick second test of resistance
Current Trend:
Hp was sideways/bearish
Increasing volume leading into recent tests of resistance
Trade Plan:
Enter HP at end of day (5/5) if above resistance line
If fails to break resistance put back on watchlist
Target Profit:
Sell 100% of position at $31.40
Stop Loss:
Initial $26.96
Trailing to low of previous day
Risk Reward Ratio:
2:1
My trading plan dictates that this is my minimum ratio
Disclaimer
Not investment advice. Thinking out loud in a crowded room.

HP for bullish divergence w.l.HP looks like a terrific stock to own for me. I would like to get in asap, but earnings on Friday keeps me on the sidelines.
The indicators are not strong on the daily chart, but on the 4 hour they are like perfect crystalline formations. I had to zoom down and do my analysis from there. Am I breaking the rules a little? Yes, I am.
Speaking of breaking the rules, I may be drawing the Fibonacci wantingly. I could see that the current correction looked like it was at or near 50%, which is a documented level, so I included it to illustrate what I was seeing.
The structure it has come down to looks fantastic. It's no wonder price is attracted to the area. Clearly buyers and sellers thought this was a fair price. I think buyers want to see if they can get a little more out of it, and frankly, if they do I think they will be coming out ahead.
-----
Price action surrounding earnings, to me, is basically random, so I will wait to see if there are any opportunities to get long after the report.


HELMERICH & PAYNE INCHelmerich & Payne, Inc. este o companie americană de foraj cu contract petrolier angajată în foraj de puțuri de petrol și gaze și servicii conexe pentru companii de explorare și producție cu sediul în Tulsa, Oklahoma, cu operațiuni în întreaga lume.


Second Entry for long lineThe price comes to the Daily Support area and almost touch it and breakthrough the short trend line and couldn't even breakdown the Gibonacci Golding area for the last wave.
Now the price tray to breakthrough the second entry for the long trend line what we see it started.

$HP with a bullish outlook following its earnings release$HP is projected to have a Bullish outlook following its negative over reaction after the earnings release, with the PEAD placing the stock in Drift C
If you would like to see the Drift for another stock please message us. Also click on the Like Button if this was useful and follow us or join us.
Double BottomPossible T2 (Long term) 33.9 to 39
Possible stop below 12.8
R at prior gap down
NV is picking up on this one
Trading the oil sector right now is risky/Folks call this one a good stock in a bad sector..lol
Possibly true..
Not a recommendation

daily analysis of HELMERICH & PAYNE INC Hi friends
the daily chart of this market shows that it will experience a downtrend in the coming days but it is better to be vigilant of the change of this market towards the opposite direction
please subscribe to receive more analyzes

HP deep buy?Can a fibo 23.6 stand here as a support line, supported with RSI 50 level?
I believe so, but wse Sl is a tick under it!

CANAL INFERIOR DE RISING WEDGECANAL INFERIOR DE RISING WEDGE, AUNQUE ES UN PATRON BAJISTA, PUDIERA CONTINUAR REBOTANDO DENTRO DEL CANAL

HP huge volume on a bullish spinning top near support zoneWeekly analysis:
- Nice weekly semi hammer with volume spike
- Nice 3 red weeks in a row
- Not much resistance up to hit 2R
Daily analysis:
- Bullish spinning top with volume spike
- Big bullish candle the day before
- Not much resistance up to hit 2R
Intraday analysis:
- Semi hammer with volume spike at the end of the day
- Higher lows
