$IBM - Head & Shoulder playing out. $133 gap fill possiblePlaying out head and shoulder. Neckline broke.
$133 gap fill possible.
Target 1 - $133
Target 2 - $130
———————————————————
How to read my charts?
- Matching color trend lines shows the pattern. Sometimes a chart can have multiple patterns. Each pattern will have matching color trend lines.
- The yellow horizontal lines shows support and resistance areas.
- Fib lines also shows support and resistance areas.
- The dotted white lines shows price projection for breakout or breakdown target.
Disclaimer: Do your own DD. Not an investment advice.
IBM trade ideas

Volatility into and on its earning day is a trading opportunityI used my biased Fibonacci channel to determine a stock major trend, minor oscillations, as well as entries/exits from trading.
The Fibonacci channel is a technical analysis tool that is used to estimate support and resistance levels based on the Fibonacci numbers. It is a variation of the Fibonacci retracement tool, except with the channel the lines run diagonally rather than horizontally. The lines from the channel is used to aid in identifying where support and resistance may develop in the future. If the uptrend is expected to continue, the 100%, 161.8%, and other higher levels are potential price targets. The same concept applies to downtrends if a downtrend is expected to continue. In an uptrend, the zero-line is like a normal trendline, helping to assess the overall trend direction. If the price falls below it, it may need to be adjusted based on more recent price action, or it could signal that the uptrend is over and that the price is breaking lower. In a downtrend, the zero-line also acts like a trendline. When the price is below it, it helps confirm the downtrend. If the price moves above it, the indicator may need to be redrawn or the price is moving higher out of its downtrend.
Fibonacci channels are highly subjective. The trader chooses three points they deem to be significant, yet the market may not view these points as significant and thus may not respect or react as expected to the drawn levels. One of the complaints with Fibonacci analysis, in general, especially on short-term charts, is that there are so many levels that the price is likely to reverse at or reach one of the levels. The problem is knowing which level will be important in advance.

IBM CONFLUENCE RESISTANCE - GAP ABOVE - ALL IN ON IBMAll,
I think IBM is primed to breakout big time downtrend is almost broken and would regain a lost massive support of an uptrend. If this gaps or breaks above I kid you not I will be closing other positions and going long call options with 2-3 month expiration on this and scale in every dip this could hit 180s with ease after breaking.

Short IBM into earningsFell out of a rising wedge and has done nothing but dead cat bounce ever since with one bear flag and now another forming behind it. I think this will tank on earnings and complete this bearish pattern with a drop to 133 to close the gap , bounce and then finish at 200ma.

IBM 1M The history of the corporation is worthy of respectInternational Business Machines Corporation is an American electronic corporation, one of the world's largest manufacturers of all types of computers and software, one of the largest providers of global information networks.
IBM owns more patents than any other technology company.
The story begins in the 19th century.
If you have been following us for a long time, you should notice that we decided to make a portfolio of ideas from assets in the stock market for the long term.
And of course, it would have been blasphemy if we hadn't written a review of such a powerful company as IBM.
The corporation has been actively developing for more than a century, making our life easier and better by introducing new technologies into it.
Looking at the chart, you can name one dark period in their history - this is the beginning of the 90s, when the price of IBM shares fell to a critical $10.
In the early 1990s, the mainframe market crisis began, which peaked in 1993. And you guessed it - the main developer of mainframes was the IBM corporation. In 1993 Many analysts talking about the complete extinction of mainframes just now, and about the transition from centralized information processing to distributed (although the last mainframe was turned off in 2013).
In 1993, IBM posted a $8bn loss - the largest in American corporate history at the time - and it was time for drastic action.
New gene. director Luis Gerstner decides to cut 20% of its employees, which is 60,000 people. It was the largest cut in American history, but helped the IBM corporation survive from 1993-1994. From 1993 to 2002, when Gerstner left the Big Blue, the company's market capitalization rose from $29 billion to $168 billion . This man is considered the savior of IBM.
The next interesting period is the beginning of 2013 , then a protracted correction in the value of IBM shares began, with which the price is now trying to start going up.
An interesting coincidence is that the price of Gold went into its 6-year correction also at the beginning of 2013.
Such a correlation might suggest that long-term investors have so much faith in IBM that they can view their stock as a defensive asset on par with Gold?)
By the way, below is our global thought in relation to Gold.
So, now let's talk about the prospects that we assume looking at the chart.
The maximum correction that we are now admitting is a fall to $110.50-112.50 , from which we expect a solid rise in the value of IBM shares.
We consider the critical level - $180
Fixing the price above this level will open the way for a long-term growth perspective to $500-530
If the market will be negative, and the price cannot break through above $180, then unfortunately, then it will already be necessary to look towards $70 per IBM share
What do you say, about such material, comes in?
Share your thoughts and expectations in the comments on IBM stock

IBM - swing trade ideaIBM Swing Trade: buy zone 133.65 - 140 USD. My setup is valid if the price stays above 129.11 USD. Minimum Target of this Impulse is at 163 USD. First important level: 152.89 (high of wave (iii).

IBM More Downside?This is a short-term possibly bearish post within a longer term bullish play. Last week IBM closed out with a big 4.5% drop in one day after news of the CEO resigning. But was this the cause or was something larger perhaps in the chart in play here?
Well when we zoom out on the monthly chart, we see back in April this year IBM broke aggressively bullish out of the downward sloping green trendline and went straight to the 0.5 fib level around $153. What was missing on this move however, was a confirming retest of the green trendline. It appears the bulls were front runners of the price, and now the retest of the green broken trendline is still well in play. There is lots of bullish confluence where the price currently sits, however. So it will be interesting to see how IBM's price will behave both this week as well as the remainder of this new month. Right now is a decent area to nibble on a long but be on the lookout for a retest of the green trendline and keep stop losses tight as this has been a roller coaster of an asset.

IBM bearish scenario:We have a technical figure Descending Triangle in US company International Business Machines Corporation (IBM) at daily chart. IBM is an American multinational technology company. IBM produces and sells computer hardware, middleware, and software, and provides hosting and consulting services in areas ranging from mainframe computers to nanotechnology. The Descending Triangle has broken through the support line on 03/07/2021, if the price holds below this level we can have a possible bearish price movement with a forecast for the next 9 days towards 136.99 USD. Our stop loss order should be placed at 147.50 USD if we decide to enter this position.


IBM Short ideaeach line listed in the box represents levels i expect to get held up at during swinging my put play if broken it will continue to move to my goal target which is 130.

Bullish run expected based on technical - not a buy or sell callI have used HH HL method to identify bullish run. Hope for best

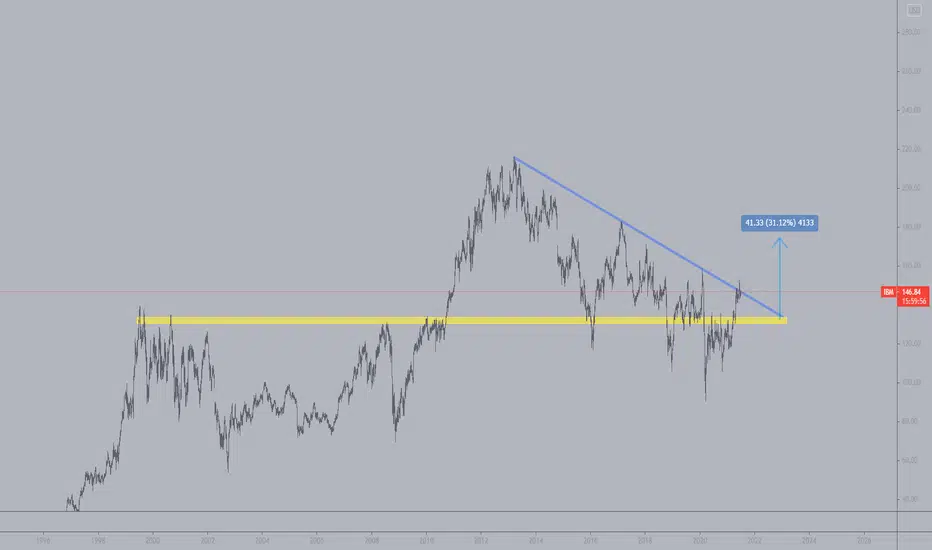

IBM case study: Breakouts after 2500 days correctionToday, I observed the IBM chart, and I noticed this huge descending channel on the daily chart since 2013, and I saw that the price was breaking it. So, I decided to go to a higher timeframe to look for similar scenarios in the past, and yes!!!!!, having data since 1985 allowed us to see how this type of situation evolved in the past. Here are my conclusions
First Conclusion: Consolidations last between 2500 and 3000 days. That's a lot...
Second Conclusion : After we have a clear breakout (always using the most external trendlines of the consolidation), the price makes small corrective movements on the edge of the structure with a duration between 150 - 300 days. The key aspect here is that we can see an ABC pattern all the time.
Third Conclusion: Based on the two scenarios we have, we can see that in the second one, we had a failed setup on the first consolidation. However, the second one worked pretty well. "Be open to failed setups, and trade again if the 150 - 300 days corrections come again.
Fourth Conclusion: The bullish movements that come after these consolidations (the ones after the breakout) goes between 90% to 500%
So what is the idea with this? The idea is that we can create a scenario where we know what we are waiting for before trading. In this case, we want to see a breakout of this 3000 days consolidation followed by a small correction around 150 - 300 days. If that happens, we will trade the breakout of it, and we will aim to have an open setup for 1 to 2 years. We think that the risk-reward ratio we can have on these types of setups is above 7 to 1. Using 2% of the capital on a setup like this can provide a 14% return over a year or two (ONLY risking 2% of your capital). The post's main objective is to show that you can create trading maps on any asset with the correct amount of past data, study previous scenarios and get ready for a current situation.
Thanks for reading!

IBM "Bullish Forecast"IBM has broken the strong declining trendline and is currently supported by it. If it manages to maintain this support,it could setup for a strong rally up. Possible TP's have been added where price action will tend to be corrective.
Only time will tell.
Happy trading.

IBM rising wedge(Short it)Suffering from the same pattern as the Dow.
1st target is gap close at 133
Dow stocks with similar pattern
Cisco
Visa
Mastercard
JPMorgan

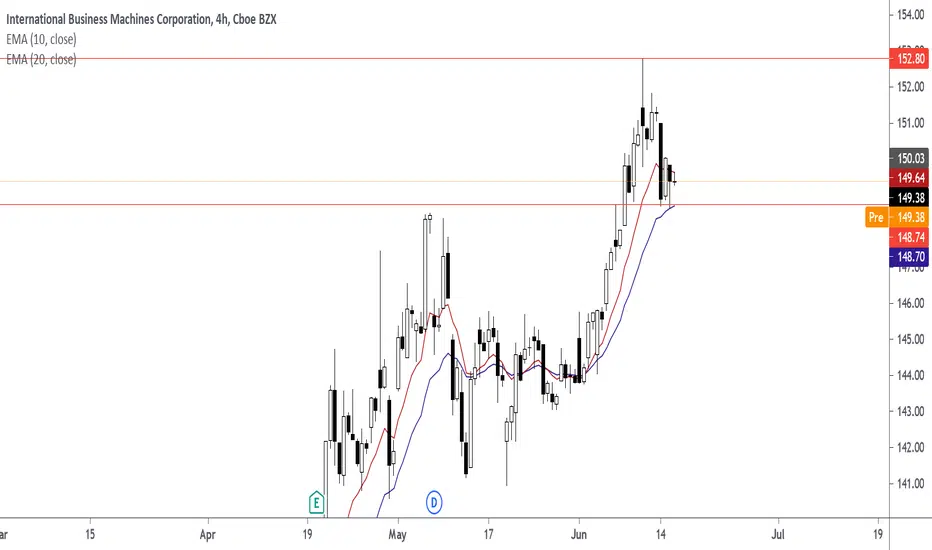
IBM will Grow up from hereAccording to my trading system IBM will Grow up from here
Buy at 149.50
exit at: 145
Target at: 158
Hope you can Give good profit from it
Good Luck.

IMB SWING Important note: ⚠️ All trades have risks that the investor must consider before investing. VivirdelTrading.club makes a disclaimer of any operation that may generate losses. All information transmitted by the channel, the page and the alert system is shared in good faith. There is no guarantee of 100% of the executed operations, as these are based on statistical models and assumptions regarding the past behavior of the price of a share, but they do not guarantee the same future behavior.

IBM (Longterm Hold) based on Wyckkoff and Large GartleyThis a HUGE pattern spanning over years both the Gartley Harmonic as well as the wyckoff Accumulation, which has recently backtested the spring and is jumping the creek. The dividends are insane on IBM too, so this is longterm account with great growth potential (better than cash). Obviously the best entries were down at the spring and backtest, but with the recent breakout of 7-8 year downtrend for the creek


IBM breaking 8 year downtrendIBM is beginning to break out on the weekly chart from a trend line that was acting as strong resistance for over 8 years.
Recently the company has unveiled the world's first 2nm chip and announced previously that it will begin focusing on Cloud and AI which will serve the company well as those are two large secular growth stories. Go Long IBM. Trades at 9.79 EV/EBITDA ratio, well run company financially with a long growth path ahead of it.
I expect IBM and INTC to be some of the main beneficiaries of the bill that just passed in the senate today that okayed $54 billion dollars for the Semiconductor Industry to focus production on American soil and improve research efforts. INTC and IBM have long been the American blue-chip players in the space and are currently collaborating in advanced semiconductor research. This is a timely partnership as INTC is building two new fabs in Arizona and IBM just released its 2nm chip but does not manufacture its own chips (ahem ahem INTC).
Long-term Price Target: $250
Daily Chart w/ Golden Cross:

IBM hitting resistance very slow mover compared to others, at big trendline resistance... if it breaks it can fly! but most likely goes lower here pretty soon. puts?
