IBM trade ideas
Short IBM Overhead resistance $151 back to $144IBM - In my opinion this doesn't have the fire power to stay above the fibonacci level $148 or break the $151 trend resistance level. Should pull back to $144-$145.

IBM earnings AH tomorrowPOS filled the gap from the previous earnings, will more than likely suck again.
Not playing this one, do your own DD. Just wanted to remind followers of earnings report. Got a feeling NFLX and IBM will tank futures tomorrow after market close.

THE WEEK AHEAD: IBM, JNJ, NFLX EARNINGS; GDXJ, GLD, SLV, GDXEARNINGS
IBM (54/26; Thursday), JNJ (56/23; Tuesday before market open), and NFLX (35/41; Wednesday after market close) announce earnings next week. Unfortunately, all of them have less than ideal metrics for a volatility contraction play (>70% rank/>50% implied), so I'm likely to pass on all of them. That being said:
Pictured here is an IBM 130/135/150/155 iron condor in the August cycle paying 1.53, break evens at 133.47/151.53, and delta/theta metrics of -2.47/2.80. The rank/implied metrics aren't ideal here (<70%/<50%), which is probably why it's also paying less than my idea one-third the width of the wings in credit. I would pass on it if you can't get filled for 1.67 or greater ... .
BROAD MARKET
TLT (31/11)
QQQ (8/17)
IWM (7/15)
SPY (6/12)
EEM (3/16)
EFA (5/10)
Short-term, broad market premium selling is about as crappy as it can get here. Your options are to (a) wait for a pop in volatility; or (b) sell something farther out in time where the expiry implied is higher. I will probably opt for the latter if we don't get an uptick in volatility by July opex, since waiting can be unproductive, particularly if low volatility has infected the entire market and it becomes a "protracted thing."
SECTOR EXCHANGE-TRADED FUNDS
Premium selling opportunities are in gold and the miners for yet another week ... .
Top 5 By Rank: GDXJ (73/34), GLD (72/15), SLV (70/20), GDX (45/28), and TLT (31/11). Metrically, the most "ideal" play is in GDXJ (exchange-traded fund ideals: >50% rank/>35% background), although we're getting somewhat short in duration for another play in the August cycle. There isn't a September expiry available yet (there will probably be one after July expires), so it might be worth a look at GDXJ next week should volatility hang in there for a September play.
IRA TRADES
Not doing a ton here beyond managing my covered calls post-opex. Stuff on my shopping list (XLU, XLP, HYG) has all ground higher along with the rest of the market, so I just have to patient for another one of those December style "sell everything" dips or a major uptick in volatility in those instruments.* Although I have "not a penny more" short puts on in HYG, both XLP and XLU are out of range of that kind of play, it seems, unless I want to go far out in time and get paid very little ... .
* -- XLU (10/14), XLP (29/11), HYG (13/6).

IBM just doesn't appeal to investors, despite RED HAT Closure Despite the closure of the Red Hat deal in super quick time, it is difficult to see and change in sentiment towards Big Blue, it is still regarded as old tech which with the acquisition is just not the case. It may take a few earnings reports to get the attention of investors once again. Growth should be considerable in the next few quarters and while you wait for that to occur a healthy dividend will keep you happy.
Technically the MACD and Histogram are turning bearish, just as the stock hits a strong long term downtrend.
Volume is still modest.
Momentum has been wavering for some time.
Stochastic is downtrending and needs to reset.
Long on break above trendline resistance on improved volume.

IBM Short BiasWelcome to everyone!
IBM just reacted to previous weekly supply area and being ready to give us some good dips.
enter always in the market zone to zone.
Happy Trading.

IBM Hitting Lower ResistanceIBM has been trending sideways, and recently filled the gap up from 4th-quarter earnings in 2018. IBM has formed an intralevel short-term bottom, which is at a short-term completion level.

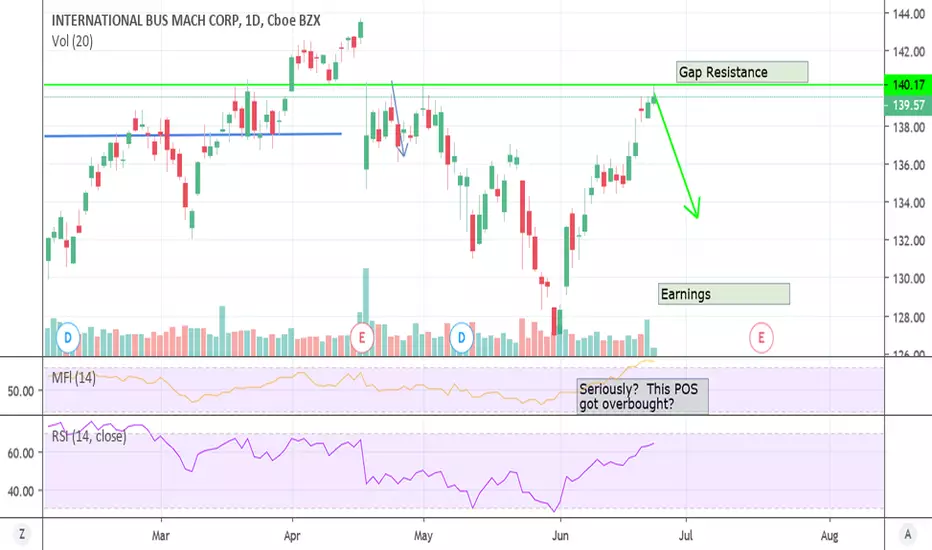
IBMHit gap resistance, I think this'll be a good one day play but I'm already shorting a DOW component and don't want to get too heavy into puts.
Should be weak up until earnings either way. Last one sucked.
In any case, do your own due diligence...

IBM 1D Potential Inverse Head & Shoulders setupIt appears that an Inverse Head & Shoulders Pattern may complete on the IBM 1 Day chart. If we pivot off a forming right shoulder pivot in the price range of $131-132.
NYSE:IBM
Spectro O is showing volume still moving in an upward direction, as well as the Spectro Ultimate Trend Analyzer shewing a solid beginning of an uptrend.
The price range according to Spectro O is showing price sitting just below the median of the Murrey Scale, which is typically an area of the scale where a weak a small pullback/correction occurs before the price continues up the price scale.
If playing from the right shoulder, employ a tight stop just below the shoulder point. The same can be said if you are waiting for a neckline confirmation to enter... stop just below the neckline, which is around $136.29.
Analysis by AlchemistLA

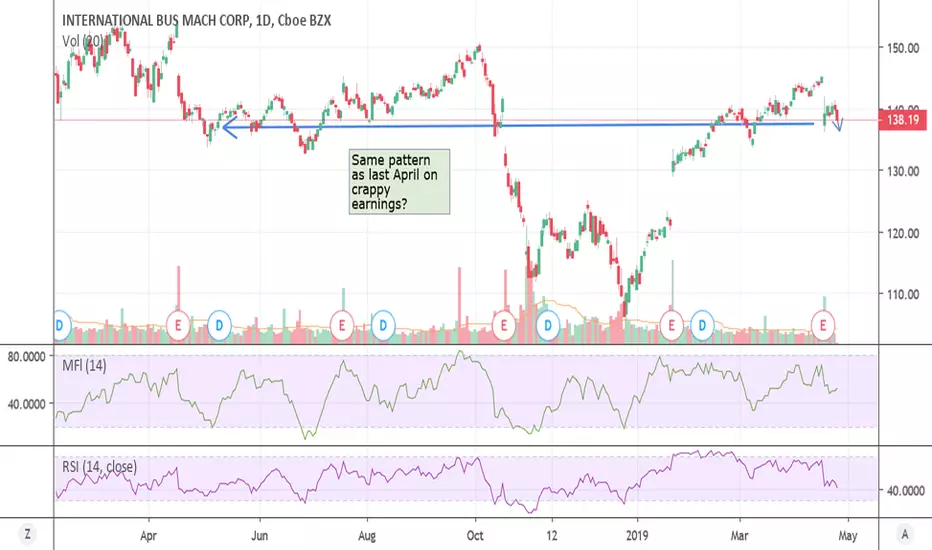
IBM Earnings Pattern Repeat?So I flipped the puts I bought yesterday for a nice 170% gain, got out because I went with weeklys. I think this has more room to drop on what appears to be a bear flag. Look at the pattern from last April, expecting something similar down to $134 support.
Remember when in doubt, short garbage, it's easier than finding a top. The market is bouncing up and IBM isn't.
IBMWhen in doubt, short garbage. In any other market this would have filled the gap below but the computerz are busy pumping futures. Don't see that happening tonight.

IBM (IBM)(NASDAQ) Sell Stop $139.78 >>> $138.26NASDAQ:IBM
International Bus Mach Corp
Stock - NASDAQ (USA)
Day Trading!
Profit:Risk = 1:1
---
Sell stop = $139.78
Take Profit = $138.26
Stop Loss = $141.31
------
Take Profit = +1.09%
Stop Loss = -1.09%

$IBM, HARD TO SHAKE OF STIGMA OF OLD TECH.IBM report earnings on the 16th of April, this could be a critical report for them as historically earnings reports have been negative for the stock with the exception of last quarter. we do not have the conviction to long this stock into earnings. Wait and see is our approach, plenty of upside or downside remain.

IBM Reaching the long term bearish trendline, there might be a possibility for a pullback here for IBM.

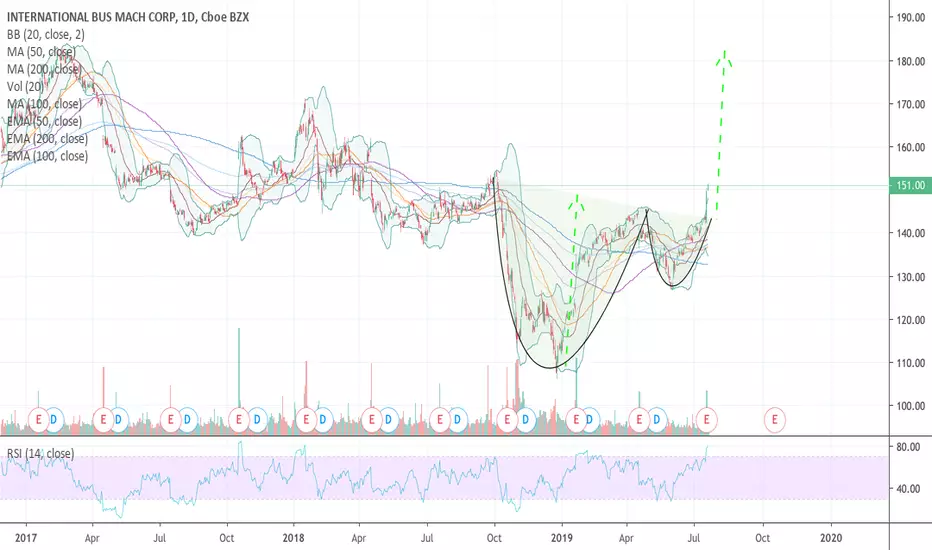
IBM: Completing a bottom with rising volume ahead of earrningsIBM is completing an intermediate-term bottom with a breakout from a consolidation, rising above the bottom resistance level and prior sideways action before the downtrend last summer. The stock has rising volume which is a positive sign for this run ahead of the earnings report in 2 weeks.


IBM SHORTIn 2018 october the IBM has been broken down the 2009 trend line. Now testing again this line. The next month it moving down to 105$

IBM Rising Wedge Short We see some good jumps on the chart, is it possible that it is time for a pullback by this rising wedge?
The wedge is closing in so the answer is near, just like the USDCHF trade I'm not trading it yet.
Would like some feedback, or a like!
Thanks for reading

