Dogs of the DOW - One Year Entrance - IBMThe current Dogs are: CVX, CAT, VZ, PFE, CSCO, IBM, BA, MRK, INTC, XOM. Take a look at each one of those names on a DAILY CHART. Set only ONE Exponential moving average on the chart. Just one. Nothing else. A 33 Exponential Moving Average, offset by 3. As soon as you get a Daily Close of any of those stocks, above that 33 Exponential moving average, buy the stock, and hold it for the year, up to February 24th, 2017. That's it, that's the entire strategy. CVX is waiting. CAT IS A BUY. VZ is a buy. PFE is one to wait for. CSCO, you buy. IBM is a buy.
IBM trade ideas

IBM Short Downtrend
Short at < 131.5 Target 117.57 Stop 133.77
Long at > 134 Target 141 Stop 131.3
Channel 117-129

IBM: Long term entryIBM is offering a great entry for the long term.
With earnings having beaten expectations for Q4, I'd be looking for a long trade here, mostly because we've hit a very strong long term support level, but also because the company's valuation at this level seems interesting.
You could look into protecting the downside selling covered calls. I reccomend a 9-18% size position here, not more.
Good luck if taking this trade.
If interested in learning more about my signals service or private coaching, pm me for more information.
Thanks for stopping by.
Cheers,
Ivan Labrie.

IBM EARNINGS PLAYIBM announces earnings tomorrow after market, so look to put on a play before market close.
Here are two possible plays, but I'm looking at these in off hours, so I'm doubtful that the potential credit to be received is accurate, although the strikes, probability of profit, and break even metrics should be fairly accurate (as usual, they may require a strike of two of tweaking after market open):
Jan 29 119/142 short strangle
Probability of Profit %: 74%
Max Profit: $147/contract (tentative)
Buying Power Effect: ~$1493
Break Evens: 117.53/143.47
Jan 29 116/119/141/144 iron condor
Probability of Profit %: 68%
Max Profit: $21/contract (tentative; if it's ultimately the case that this setup will yield <1.00, I would pass on it or look at widening the wings to yield additional credit, assuming that's consistent with your risk tolerance)
Buying Power Effect: ~$279
Break Evens: 118.79/141.21
Notes: I'm already in an IBM trade left over from last earnings that I'm working on, so I won't be playing this one .... .
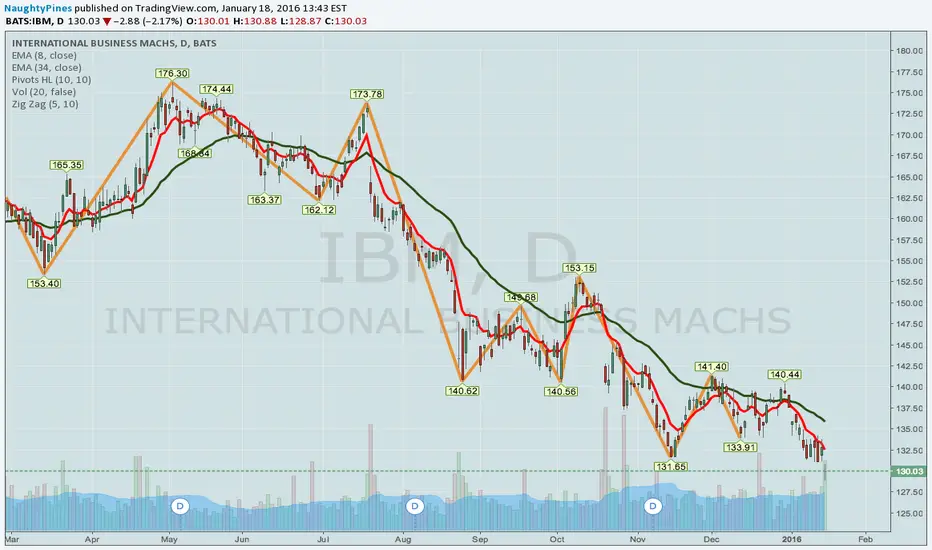
35% Upside potential next 6-months is very likelyPrice is at very attractive levels for many reasons and bottom is not far from here though it may shake out one more time. If it fails to hold this multiple year support next stop is very likely $116 area. We believe there is a possible bounce from these levels at and around $130 and retest May high last year before it heads another new lower lows. Go www.2waytrading.com for real-time alerts

IBM CALL & PUT PLANDOWN TREND
=> PUT PLAN : when price below 131.6, SL 133, Target 121.15
=> CALL PLAN: to pen position when support line is working, price break 131.6, SL 131.1, Target 133.82


Can Apple save IBM or visa-versa?IBM ($IBM) continues to be bearish even after announcing partnership with Apple ($AAPL). Investors will avoid buying it before earnings announcement (Jan 18 - Jan 22 (Est.))

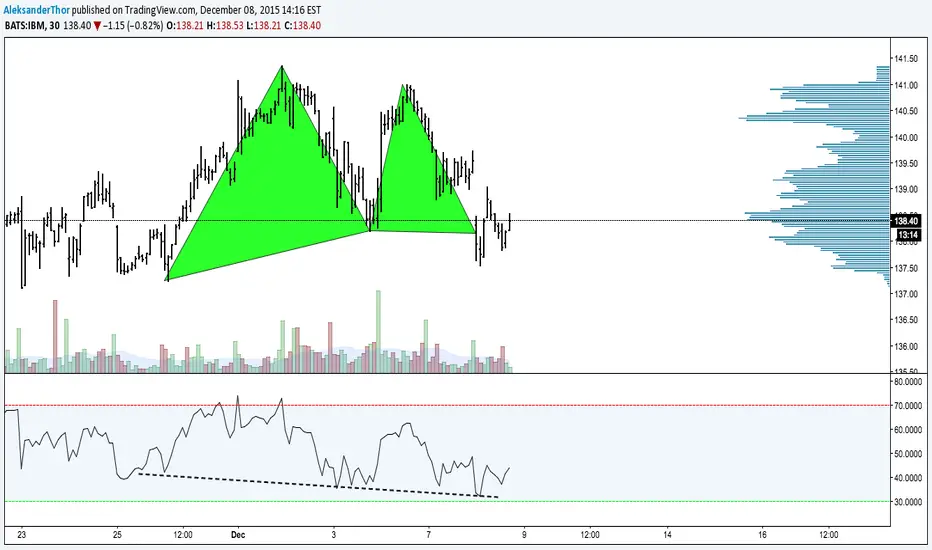
Long IBM / didn't break supportFailed to break support area, may test again but risk reward is very good 4:1

LEG into an IRON CONDOR on IBM Moving sideways, i have an JAN 16 order for a bear call spread 141/142
Everything looks to confirm sideways movements especially the bearish engulfing candle on 12/30

IBM IRON CONDOR (UPDATE ON BROKEN EARNINGS SETUP)This is becoming somewhat of an epic, post-earnings work-off setup.
Without boring you with all the details (which are outlined in the post below), my post-earnings setup, after rolling and such is currently a Dec 7 140/143/140/143 iron condor. The 140/143 is the put wing and, yes, the 140/143 is the call wing (so it's basically inverted, with the call wing below the put wing; in short, it's an f'd-up setup).
In any event, the 143 long call of that setup is nearly worthless, has done its job, so I'm going to take it off here for a .05 credit. The short call I will take off for as much I can get for it.
Thereafter, I will have to roll the put side, most likely no later than Tuesday of next week, since I don't see IBM pounding above 143 (my short put strike) in short order. What I'm going to do is look to roll it out 45 DTE, but I'm going to first see what I can get for a 1 SD short call vertical at that expiry (it will be some kind of credit). Once I know what that credit is, I will look to see how much I can improve the short put side in terms of its strikes, because I don't want to pay more to roll/improve the short put side that I can receive in credit for the short call side.
The unfortunate thing is that a 45 DTE will most likely be beyond IBM's next earnings announcement, so I will have to watch to see if I can take advantage of price movement/volatility around that event in order to improve the put strikes further ... .


The most interesting stock from a TA perspectiveAlmost everything I know about TA is represented in this chart!


DOW JONES OVERVIEW: IBM ON LONG TERM RISKIBM is on risk of 5-year downtrend after falling out from 1st standard deviation from 5-year mean.
Additionally, price has fallen out of 1st standard deviation from 1-year mean, this is on short term downward risk as well.
Thus unless price trades back above short term risk order @ 150.5 - and then back above larger downtrend risk border @ 157.5 - risk of continued downtrend on IMB persists.

Put Ratio Backspread, Shorting the gap Well as this stock did gap down with good volume supporting the move. I decided to enter short through a Put ratio backspread. Reason being that this options' strategy simply limits my risk in regards to the large gap between 172.50 / 162.50. All in all, I'm looking for further downside to retest the 150.00 / 152.00 area.
For those wondering what a ratio backspread spread is I'll give you a link with a definition of it. Feel free to also just google put ratio backspread if you want to find a better explanation of it.
www.theoptionsguide.com
The position:
Bought +2 100 AUG 15 157.5 Puts
Sold/Wrote -1 100 AUG 15 162.5 Puts
The trade:
Exiting at a loss if we get a daily close above the 200 Moving Average.
Exiting at a profit if we reach the 150 / 152 area.
Cheers, happy trading! =)

Shorting IBM on weak fundamentals and appropriate wave structureYesterday the company published a mixed earnings report. It reported:
* earnings per share of $3.84 versus expected $3.78; that's a beat.
* revenue of $20.8 billion versus $20.95 billion, that's a miss, and the 13th consecutive quarterly decline.
The stock lost nearly 5% in the after hours. We are expecting more downside, as the wave count suggests the continuation of a longer-term downtrend. Stop-loss is a daily close above 170.

IBM Ready For A BreakoutIBM had a disastrous quarter in Q3 2014, where growth dramatically slowed. The market has punished IBM by selling it off hard. Following its drop from $190 to $160 IBM went into a long period of accumulation. The chart reminds me a classic Wyckoff pattern. As Richard Wyckoff explained in his seminal book on tap reading, large Wallstreet operators are not afraid to buy a fallen stock, provided the stock is large, liquid and has good earnings. In fact, they welcome an opportunity to accumulate shares at discount prices confident in their ability to mark up the stock once they have built a full position. While Wyckoff's work cover the classic period of 1920-30, I think its core is as relevant today as it once was.
IBM fits the profile perfectly. It is an institutional stock that mutual fund managers are extremely comfortable with. Therefore, it is reasonable to assume that large operators are accumulating the stock. The chart, in general, seems to confirm. You can see a typical pattern of the stock being stuck in a ~ 8% range with a very strong support in $152 area. The support has been tested 3 times so far and held up. Finally, on April 23 IBM broke out of the range on increased volume. This is a sign that accumulation is over and the large operators are ready to mark up the stock.
optionsforum.net

Warren Buffett IBM train taking offIBM is the third highest valued holding of Berkshire Hathaway. Mega accumulation in strong hands. From what seen in his other holdings, he treats his stock well.
Careful of investing on blind speculation, and have some of your own TA to back it up. But from what I see, the last dip was swallowed, so that price range would be an ideal area to enter at low risk if we get a retrace.
Enjoy

