IBM Corp Daily (10.Sep.2014) Technical Analysis Training The IBM Corp (NYSE:IBM) Daily Diagram Technical Analysis training shows the following:
IBM share has declined following a resistance red line into a triangle. The weekly diagram is neutral.
So the first think in mind is the reaction from the KUMO.
We have no special candlestick pattern. The share is on the KUMO and under the Tenkan Sen too (green line). The SPAN A is above SPAN B.
There is no special pattern.
Long for the upper resistance first. Stop loss under the KUMO.
**In a long term view I saw a reversal pattern that could drive the share at 220 and upper.
IBM trade ideas

IBM Bulls need to keep the fight Last 3 sessions, market helped the bulls to keep the fight, but it looks bears are not giving up soon. The chance the price to retrace back to 186.20 increased today. We had entered or recommended short entry at 192 last Thursday with target price $186.20 area.There is a large bearish triangle in the process, last higher lows at and around 183. 58 the low of this month stopped short to breakout downside, and rebounded with light volume as the general market did it. Now, there two conflicting bullish/bearish triangle but the chance to see that happen will depend on what market does next few weeks. Until then, we expect to make a few QLT/QST trades. The site now is open for new clients if you are interested in you can checkout www.2waytrading.com
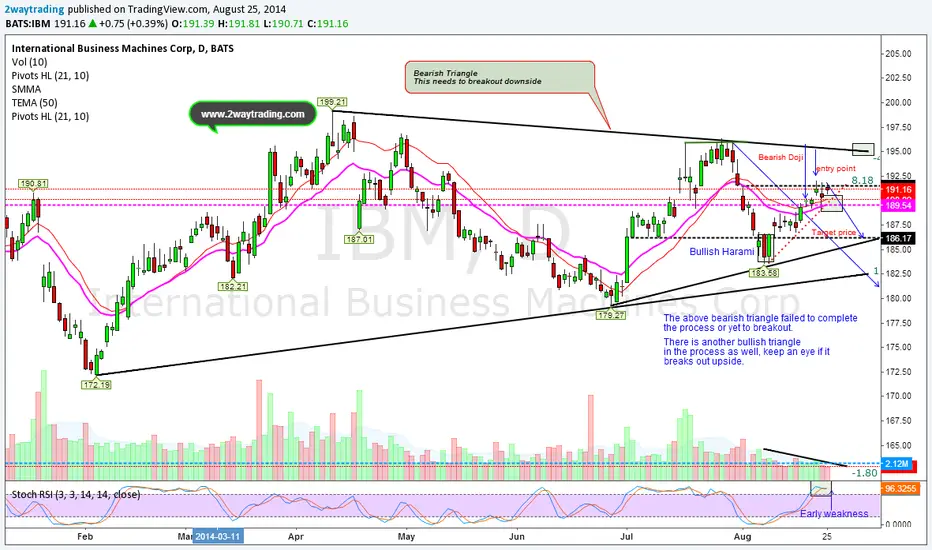
Will $IBM Clear overhead resistance?See the notes on the chart. We may initiate a trade soon. Now, there is no position. If you decide to take a trade do your own risk management.

IBM Daily (18.08.2014) Tech Analysis EMAThis week we will see the EMA (50,100,200) and MACD,RSI for various diagrams.
The IBM Share (IBM) Daily Diagram Technical Analysis Training shows the following:
The IBM tries to breach the EMA 50 today with a long green candlestick from 0.5 of fib to 0.618. There is a sense of bull market because the EMA 50 is above EMA 100 & EMA 200 and EMA 100 is above EMA 200 too. There are some Golden crosses last month.
MACD is turning bullish on the zero line. RSI moves to 51.
There is a support line and all seems bullish.
If it closes as is, long for 191.96 first and stop loss under 187.73.

Updated 14 Months, IBM Circle Cycle Theory I've made an enormous amount of progress in the past 14 months concerning a price action system that works for me. Tim West asked me to update this chart, and I've cleaned it up, scraped the circle theory idea, and replaced it with my own system that is far more accurate and MUCH more simple.
Essentially, I created this chart with much less understanding of how markets move. Today, I've annotated areas of accumulation, distribution, legs, and levels. The areas of support gained will eventually become support lost as price attempts to retest the Leg Start. This is a rule that price always follows, but could take time. You will also notice that key levels also usually line up with Fibonacci levels. I only use fib levels for all time high breakouts these days, but call it whatever you like, I just included it for those of you that like using fibs.
The target area that I'm interested in is the first touch of the Leg Start around 130, and if momo continues, even a test of the LS Mean Point around 100.
Chart from 14 Months Ago:

IBM Corp Daily (12.08.2014) Technical Analysis TrainingThe IBM Corp (NYSE:IBM) Daily Diagram Technical Analysis training shows the following:
IBM share has reacted from the bottom of KUMO and nw is exactly on the EMA 200. The 0.618 of fib @188.42 is the test for today.
So the first think in mind is the overcome of Top of KUMO and the KijunSen_Tenkan Sen resistance at 189.99 for this week.
We have no special candlestick pattern. The share is into the KUMO and under the Kijun Sen (blue line) and Tenkan Sen too (green line). The Chikun Span has a block of resistance.
There is no special pattern.
Long for 188.42 first and 189.99 secondly. Stop loss 185 (0.5 of fib).

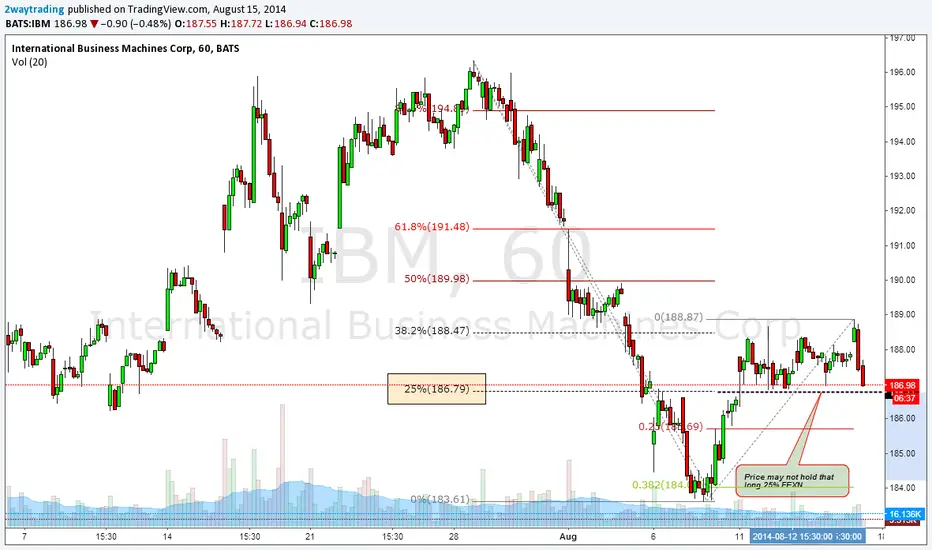
$182.50 Buy zone from the sell offBoth last QLT and QST worked well. Expecting price to hit entry level for swing trade. Stay safe ad tuned for more to come.

IBM Corp Daily (07.08.2014) Technical Analysis TrainingThe IBM Corp (NYSE:IBM) Daily Diagram Technical Analysis training shows the following:
IBM share has declined sharply 29.07.2014 braking the support trend line (green) down. Now the price is exactly on the 0.5 of fib support.There is a new resistance line (red).
So the first think in mind is the support of 0.5 of fib or not. MACD is bearish and RSI too. The volume now is the usual.
We have no special candlestick pattern. The share is into the KUMO and the Kijun Sen (blue line) too but on the Tenkan Sen too (green line) that support the share. The Chikun Span will show today's support or not.
There is no special pattern.
In last diagram we have report to be careful @ $196-$197 because the returns from $180 to $195 movement was about 8,3% and we had a profit take event.
For a long view the share must test the top of KUMO. Otherwise short under resistance line.

Wide Range Sell-off Bars At Highs Are A Warning Sign One of the best chart patterns to spot a major downside move in a stock before it happens, is when there is a wide range reversal bar from a high. For example, take a look at the chart below of International Business Machines (NYSE:IBM). This is a weekly chart of the stock which shows a major decline in April 2013. Notice the wide range sell-off bar that was very close to the high. At the time of the decline, IBM stock was trading around $212.00 a share, by the time that red bar closed the stock was trading around $190.00 a share. Now that is a wide range sell-off bar from a high and it will usually always indicate lower prices ahead for the stock. As you can see, over the next six months the stock declined as low as $173.00 a share before being defended by the institutional money. Take a look at other charts where a stock sold off sharply from the highs and you will see that it was often an indication that the stock was going to decline further in the near term future.
Nick Santiago
www.InTheMoneyStocks.com

Big Blue Turns Red (NYSE:IBM). Day Trade Level Here...This morning, leading tech giant International Business Machines Corporation (NYSE:IBM) is trading lower by $2.36 to $189.31 a share. Recently, it has been reported that there has been some insider selling from corporate officers in late July. This insider selling news could be weighing on the stock today. Day traders can now look for intra-day support on International Business Machines Corporation (NYSE:IBM) stock around the $187.83 level. This is an area where day traders should expect a short term bounce. Only trade the best levels, this support area is a high probability level for a day trade, however, other factors should be considered when/if IBM trades down to that level. Keep this level on your charts...
Nick Santiago
www.InTheMoneyStocks.com

IBM Corp Daily (28.07.2014) Technical Analysis TrainingThe IBM Corp (NYSE:IBM) Daily Diagram Technical Analysis training shows the following:
It is exactly the same diagram like last two. The IBM share has extended the bullish movement above the support trend line (green) as the new agreement with Apple came out. This support line is now above the KUMO, which means that the IBM is forcing its bullishness. The weekly diagram shows bullish. The monthly is neutral.
So the first think in mind is the 196.35 level of resistance line. MACD is bullish and RSI too. The volume now is the usual.
We have no special candlestick pattern. The share is above the KUMO the Kijun Sen (blue line) and Tenkan Sen too (green line) too.
There is no special pattern. So hold Long IBM and be careful @ $196-$197 because the returns from $180 to $195 movement is about 8,3% and maybe we have a profit take event. Today the share is trying to stay above the support line but it needs more volume.

I think the movement will continue within the current trend.I think the movement will continue within the current trend.

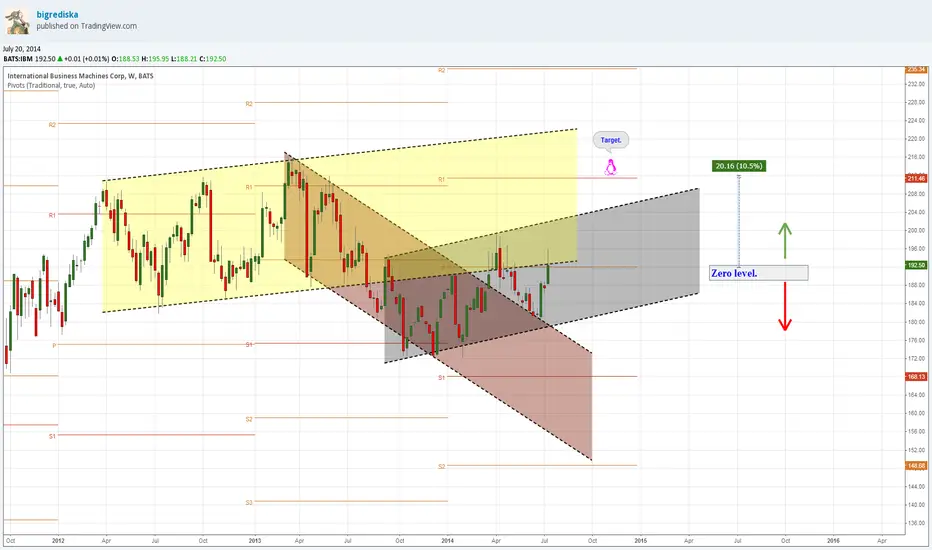
There is an attempt to return to the yellow trend.The chart trying to get back in the yellow trend. If to take into account the fact that the upper boundary of the current trend is above is quite possible. The lower bound of yellow trend coincides with the zero level of the pivot. This confirms the possible beginning of a rise.
IBM Corp Daily (19.07.2014) Technical Analysis TrainingThe IBM Corp (NYSE:IBM) Daily Diagram Technical Analysis training shows the following:
It is exactly the same diagram from 10.07.2014. The IBM share has extended the bullish movement above the support trend line (green) as the new agreement with Apple came out. This support line is now above the KUMO, which means that the IBM is forcing its bullishness. The weekly diagram shows marginally bullish. The monthly is neutral.
So the first think in mind is how bullish will be the promise of the agreement between these companies. MACD is too bullish and RSI too. The volume in three last days is almost double than the usual.
We have no special candlestick pattern. The share is above the KUMO the Kijun Sen (blue line) and Tenkan Sen too (green line).
There is no special pattern. Friday movement closed the uptrend gap. The fib from $172.82 to $198.06 shows the support now of 0.764 ($192.10).
Next target $198.06.

$IBM Today's pull back is opportunityYesterday's news with $AAPL partnership helped the stock to pop and continue today, but market hit by plane crash in Ukraine has stopped the upside momentum which will probably continue once the dust suttles. The falling wage had a measured move towards %196.60 which also falls at 61.8% golden ratio of FIBExn

IBM Corp Daily (10.07.2014) Technical Analysis TrainingThe IBM Corp (NYSE:IBM) Daily Diagram Technical Analysis training shows the following:
The IBM share has made a short term bullish movement above the support trend line (green). This support line is under the KUMO, which means that the IBM is reacting weakly yet. The weekly diagram shows neutral trend. The monthly is neutral too.
So the first think in mind is the break or not of the support line. MACD is weakening its bullish and RSI too. The volume is as usual.
We have no special candlestick pattern. The share is under the KUMO but is above the Kijun Sen (blue line) and Tenkan Sen too (green line).
There is no special pattern. The fib from $172.82 to $198.06 shows the support and resistance levels..
So I think that anyone must stay aside. If the share moves under the support line the next stop is Kijun Sen and 0.382 of fib (182.46). If it gets into the KUMO the it will retest the $188.42 for $192.10. The share needs larger volume from bulls.

IBM Corp Daily (23.06.2014) Technical AnalysisThe IBM Corp (NYSE:IBM) Daily Diagram Technical Analysis shows the following:
The IBM share has made a long term decline under the resistance of the trend line (red). This resistance line is under the KUMO, which means that the IBM is bearish in long term. The weekly diagram shows bearish trend. The monthly is bearish too.
So the first think in mind is that the share will decline more. The stock in Friday close on its lower low almost. MACD is bearish and RSI too. The volume on Friday was double the usual.
We have no special candlestick pattern. The share is under the KUMO and the Kijun Sen (blue line) too. Last week it failed to get over the Tenkan Sen (green line).
There is no special pattern. The fib from $172.82 to $198.06 shows a 0.236 decline at $178.77 first target.
So I think that the share will decline more.

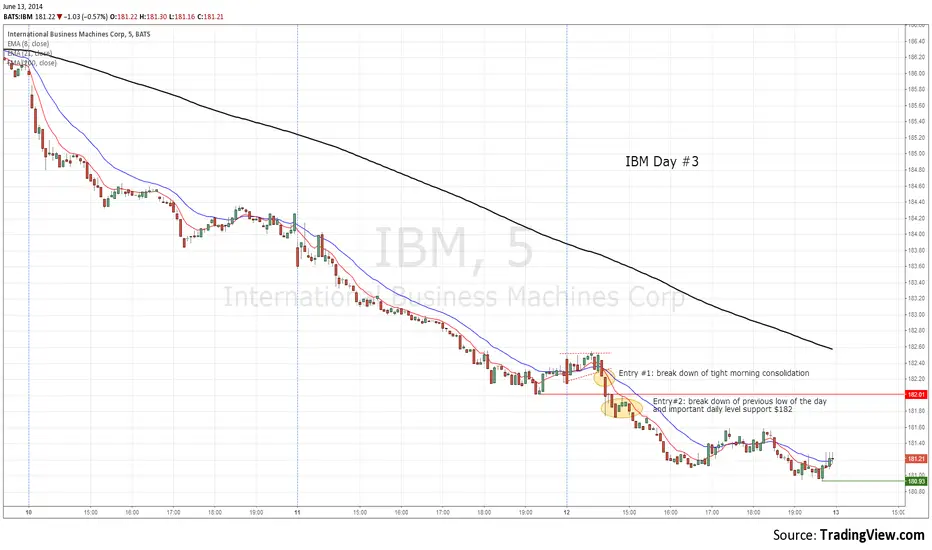
IBM day #3, broke down of $182 important levelIBM is going down in very nice move. Reached my first target in 3 days (check my idea in link below).
After 3 days down move it needs some rest before continuation.
Need to stay below $182 for further down move
IBM trade reviewIn the morning I was talking about IBM short idea. Price confirmed idea.
This is trade management review because entries and exits matters.
Comments on the chart.
Check my idea in the link below

IBM bounce off of trend line and 200 EMA IBM is trading relatively weak to the market which is currently on highs and stock is depressed and below 200 EMA.
After strong break up of $190 resistance it caught some follow through right to $199, but then dissapointing earnings was released and it dropped on powerful gap down.
Series of lower highs and lower lows means that it is in down trend and sellers are in control as it is trading below all key moving averages.
ENTRY trigger below previous low of the day at $186. STOP above pivot high and 200 EMA at $188 makes sence. TARGET #1 at previous low $182 then we have major support at $172. Risk/Reward 1:2 makes this trade worth taking.

IBM Corp Weekly (23) Chart Technical AnalysisThe IBM (IBM) weekly chart shows the following signs:
The Price of IBM came into the KUMO and stopped at Kijun Sen resistance. The Stock is over the EMA200 making a triple bottom from Oct 2013 till Feb 2014 on it. The MACD and RSI are mixed to bearish.
If today (Monday) the stock is long, the next target is the resistance of Tenkan Sen at around the $190. Otherwise the bearish signal could be given under the weekly support line for the strong support line first at around the $172.

Long distance to the next support.Month begins with rise. It is important that it will be completed by fall.
