INTC: Bullish Shark and Breaking Back Above The 200 Month SMAIntel has made a full reset down to the PCZ of a perfect Bullish Shark Harmonic on the Monthly Timeframe and it went below the 200 Month Moving Average to do so but it was short lived as price only a month later managed to get back above the 200SMA and close above it. I now believe that we could atleast see price test the 50% - 61.8% Retraces above but if the Dow reaches all time highs as i am somewhat leaning towards then we may see Intel make an even more surprising and extended move to the upside from here beyond the .618 retracement.
INTC trade ideas

INTC bull flagINTC looks to be creating a bull flag on the daily chart with a clear upward momentum. All EMAS are facing upward in a strong way. The volume is strong and the RSI remains up trending. After the green fib was taken the famous .5 fib seems to be the next target. Since flags like to mistreat me lately I am predicting a massive bounce off this fib to the golden .5. This is a text book momentum play. I am long here.

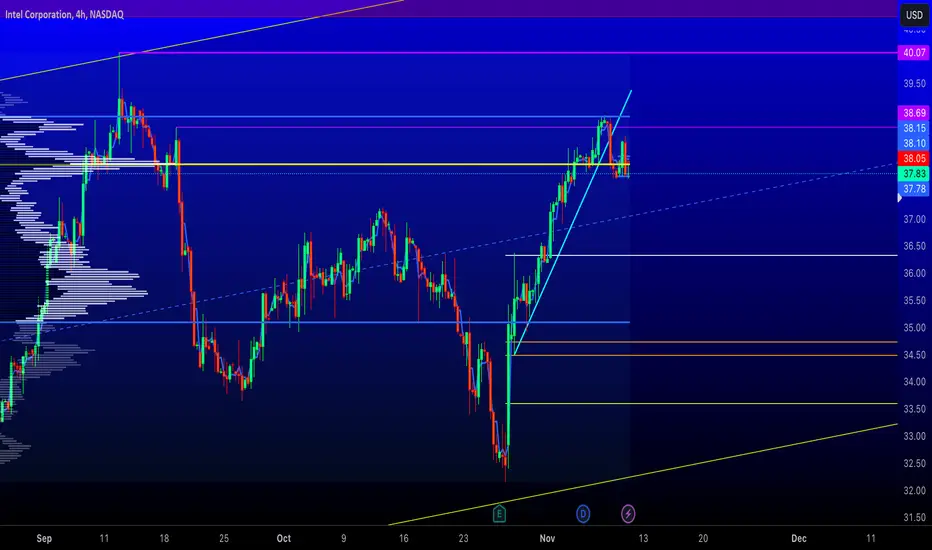
INTEL Finally back at 1 of it's MOST respected LevelsINTC back at (many times and well) respected historical support level, currently breaking resistance after a huge runner up of approximately 40% from previous support @ 32.15
Will INTC continue it's upwards momentum or is it time for a cooldown.
Draw 3 possible scenario's.
Trade Safe - Don't forget to Take Profit - Eyes on the price

#INTC#Comprehensive Analysis of Intel Corporation (INTC)
1. Current Status and Performance 📈
As of the most recent data, the current price of INTC is $43.92. Over the past 12 months, INTC has returned 26.14%, outperforming the SPY's performance of -13.83%. This performance has earned it a B (66.17%) for its Overall Grade.
2. Financials 💰
Intel's financials reveal a mixed picture. The company has a revenue per share of 12.5806 and a net income per share of -0.3929. The operating cash flow per share stands at 1.8681, while the free cash flow per share is -4.0226. The company's cash per share is 5.9566, and the book value per share is 24.2296. The company's debt to equity ratio is 0.48, indicating a moderate level of debt relative to equity.
3. News and Market Sentiment 📰
Recent news stories suggest a positive outlook for Intel. Despite a downturn in the PC market, which provides 55% of the company's revenue, Intel's stock has risen 46% over the past year. The company's Q3 revenue of $14.2 billion suggests a potential recovery. Intel's Q4 guidance predicts $15.1 billion revenue, an 8% increase from last year, and earnings could double to $1.90 per share by 2024. Based on these figures, Intel's stock price might increase to nearly $52 over the next year, a 20% rise from current levels.
4. Earnings Report and Dividend Yield 💵
Intel is expected to report an EPS of 0.43 and $12.74B in revenue on 2024-01-25. The company has a total dividend yield of 2.23%.
5. ESG Data 🌍
Intel's ESG scores are relatively high, with an environmental score of 79.8, a social score of 83.15, and a governance score of 81.63. The overall ESG score is 81.53.
6. Future Outlook 🚀
Based on 27 Wall Street analysts offering 12-month price targets for Intel in the last 3 months, the average price target is $37.39 with a high forecast of $56.00 and a low forecast of $17.00. The average price target represents a -14.65% change from the last price of $43.81. However, the long-term forecast suggests that Intel's stock price will hit $50 by the end of 2023 and then $60 by the end of 2024. Intel is expected to rise to $65 within the year of 2025, $75 in 2026, $85 in 2027, $100 in 2028, $110 in 2030, and $125 in 2033.
7. Conclusion 🎓
Intel Corporation appears to be in a strong position, with positive news sentiment, a robust financial performance, and a promising future outlook. However, as with any investment, it's crucial to consider all factors and conduct thorough research before making a decision. It's also important to consider your own investment goals and risk tolerance.

Back to IntelIntel has been left behind in the Micro-chip Bullrun but the stock has performed pretty well Year-to-date. With the price at resistance and the stochasticRSI indicator topping out, we are looking at buying Intel at the prices indicated on the chart if the market cools down in December and profit-taking brings the price to either $35 or $25.
If the market stays strong, Intel will push higher through 2024 and catch-up to the NVIDIA hype.

Intel corporation SHORTLooks like its going to test this level. would be a perfect trade to finish the wave C.

INTC, 9d/-10.64%falling cycle -10.64% in 9 days.
==================================================================================
This data is analyzed by robots. Analyze historical trends based on The Adam Theory of Markets (20 moving averages/60 moving averages/120 moving averages/240 moving averages) and estimate the trend in the next 10 days. The white line is the robot's expected price, and the upper and lower horizontal line stop loss and stop profit prices have no financial basis. The results are for reference only.

INTC - Bullish Candlestick PatternsIntel Corporation is displaying Bullish Candlestick Patterns. It is representing tweezer bottom a type of bullish candlestick pattern

INTEL.....Stock has bottomed!Hello traders,
Time to take a look at INTEL, the dinosaur of the US markets!
I wrote an analysis that worked well, and I put the stock on my watch list!
I think the stock bottomed @ $32.15 on October 26th and has since rallied to a new 52-week high. The next one is at $44.93 on June 01, 2022!
If traders enter the stock with a call option, I recommend waiting for a corrective pullback in the coming days. A possible range could be at or around $41. To protect your capital, I recommend selling a call at this level. There are many other strategies.
If the stock continues to spike, target areas range from $44.93 to $48.90 to $52.51!
Be patient these days and take care.
Have a great week.....
Ruebennase
Please ask or comment as needed.
Trading based on this analysis is at your own risk.

INTEL, Keep an eye out for potential opportunities
Keep an eye out for potential opportunities when the stock price exhibits an upward trend and demonstrates a resurgence in buying strength following a dip.

$INTC - the sleeping giant has finally woken up NASDAQ:INTC has broken the resistance and is steadily moving upwards.
Buy volume has increased.
Entry can be made with stop loss at $ 40.03.

$INTC putBought Dec. 15th $41 put for $3.
NASDAQ:INTC is at a local top, there is not much premium in the option.
My break-even is $38

Intel, waiting to resolveThe technicals are neutral right now. We are in a consolidation triangle which normally will break to the downside. Nevertheless if we get a break of 31 a bullish reversal is validated and it will be a strong buy.

WOW OH WOW. Minus $1 to target please!!INTC is failed the most recent high, it broke its uptrend and sold off right below the point of control (yellow line). I would expect a sell-off to continue to the .382 (white line which is also the next area with the most amount of volume traded.
Calculate Your Risk/Reward so you don't lose more than 1% of your account per trade.
Every day the charts provide new information. You have to adjust or get REKT.
Love it or hate it, hit that thumbs up and share your thoughts below!
This is not financial advice. This is for educational purposes only.
Intel Monthly LinearSerious question for all experienced chart traders.
Which of those 2 topping structures created more damage to the #Intel price chart?
Feel free to repost so we get a maximum of replies.
#trading #technicalanalysis #nasdaq #stocks

INTC short to $32 in two stepsNASDAQ:INTC reached the price target level of $40 and now is going to correct to $30-$31 in two steps.
On 1D chart MACD shows its highs.
1st step: INTC - fall to $34-$35 to its MA50
2nd step: INTC - fall to $30-$32 to its MA100

INTEL 10-month Channel Up targeting $40 and $43 in extension.Intel Corporation (INTC) has been trading within a Channel Up throughout the whole year and as you can see on the chart, the pressure points are best displayed with the use of the Fibonacci Channel levels. Last Thursday's bottom on the Higher Lows trend-line couldn't have come at a stronger demand level, as it hit (and immediately rebounded on) the 1D MA200 (orange trend-line).
The price even broke and closed above the 1D MA50 (blue trend-line) yesterday and more importantly completed the first 1D MACD Bullish Cross below 0.0 since August 30. It is a similar rebound sequence where again the price was just above the 1D MA50 and eventually completed a +25.24% rise, marginally above the 1.382 Fibonacci horizontal extension. Every time the 1D MACD formed a Bullish Cross below 0.0 within this Channel Up, we had the same bullish confirmation signal and the stock rose by +25.24%, +38.83%, +36.47% on those occasions, always hitting at least the 1.382 horizontal Fib level.
As a result, we expect the stock to complete the 'minimum' +25.20% fractal rise, thus we target $40.00 on the short-term and on the long-term, extend to at least $43.00, which is the 1.382 Fibonacci extension and would make an optimal technical Higher High on the 2023 Channel Up.
-------------------------------------------------------------------------------
** Please LIKE 👍, FOLLOW ✅, SHARE 🙌 and COMMENT ✍ if you enjoy this idea! Also share your ideas and charts in the comments section below! This is best way to keep it relevant, support us, keep the content here free and allow the idea to reach as many people as possible. **
-------------------------------------------------------------------------------
💸💸💸💸💸💸
👇 👇 👇 👇 👇 👇

INTC short into rising D/W wedgeNot favorable time for stocks. Intel as one of few big caps doing well in recent weeks. Raising wedge with decreasing volume. Potentially good spot for shorting the stock.
SL: daily close above 39
TP: on long term trend line

Intel's Is Gaining MomentumPrice Movement
INTC is trading near the top of its 52-week range and above its 200-day simple moving average.
Investors are applying buying pressure to INTC shares today.
Intel (INTC) reported third quarter results that surpassed expectations on both revenue and earnings. The company also issued better-than-expected fourth quarter guidance. Intel CEO Pat Gelsinger acknowledges there were some headwinds Intel was facing when he took the job, and his goal was to "rebuild this iconic company." With the latest results, he says "people can see the momentum is building" at Intel thanks to cost-saving initiatives, product execution, and its internal foundry model.
Intel plans to launch new products including the Core Ultra processor, which Gelsinger nicknamed the "AI PC". Gelsinger says the AI PC aims to keep users from having to go to the cloud to utilize AI, instead, the features and data are readily available on the device itself to improve productivity. Gelsinger says these products will help Intel capitalize on the "surge in AI interest we're seeing across the board."
With new products slated to launch over the next two years in its data center unit, Intel CEO Pat Gelsinger believes the chipmaker can regain lost market share and boost competitiveness, stating 2024 is when Intel will "start gaining back share" thanks to its upcoming product releases.

INTC Intel Corporation Options Ahead of EarningsIf you haven`t bought the Double Bottom on INTC here:
Then analyzing the options chain and the chart patterns of INTC Intel Corporation prior to the earnings report this week,
I would consider purchasing the 34usd strike price Puts with
an expiration date of 2024-1-19,
for a premium of approximately $2.56.
If these options prove to be profitable prior to the earnings release, I would sell at least half of them.
Looking forward to read your opinion about it.

intel - analysis - inside 💻Hello TradingView Family / Fellow Traders. This is Richard, also known as theSignalyst.
📉 INTC has been overall bullish trading inside the rising wedge pattern in blue and it is currently approaching the lower bound / blue trendline.
Moreover, the 31-32 is a strong support zone.
🏹 So the highlighted red circle is a strong area to look for buy setups as it is the intersection of the green support and lower blue trendline acting as a non-horizontal support.
📚 As per my trading style:
As INTC approaches the lower purple circle zone, I will be looking for bullish reversal setups (like a double bottom pattern, trendline break , and so on...)
📚 Always follow your trading plan regarding entry, risk management, and trade management.
Good luck!
All Strategies Are Good; If Managed Properly!
~Rich

Daily Support INTC BounceShould bounce off the daily support otherwise we'll see a break in the head and shoulders neckline and will see $31-$33 per share
Use a stoploss please

Head and shoulders on intcINTC after experiencing a hell of a rally is setting up for a head and shoulders here. RSI is in the gutter as well.
