Intel - probably higher by year-endToday's earnings news will be digested by middle of next week. But we'll still be talking about semiconductor shortages for months to come.
I wanted to slow it down by looking at the monthly chart with a long-term linear regression channel.
Intel might be a bit oversold here. Monthly chart not a great way to view stock movement relative to earnings, though.
Didn't Intel just announce two new chip factories in Arizona? Didn't they make an offer to buy Global Foundries?
Will an investor (or trader) receive more value from buying the Global Foundries IPO or from bottom fishing Intel near-term?
INTC trade ideas

The critical importance of time frames INTC exampleAs in life, the questions you ask will determine the answers you get when it comes to trading. We live in an age of "instantism" - we have been conditioned to believe that faster is better – faster price executions, faster trading, faster feedback, faster news, faster food, faster everything! And this need for speed has been translated into trading. I know whereof I speak since as recently as 8 years ago the vast majority of my trading was day trading. But I no longer believe that day trading is viable for most people unless they trade large positions for very predictable small moves. That's what high-frequency trading is all about. I have no need or interest in a 10 second chart. But that is of course personal preference. As an example of what I'm referring to take the current situation in Intel as shown in chart form above. The moving average channel method that I developed many years ago clearly shows the trend has been consistently higher with support coming at or slightly below the moving average channel monthly chart per the methodology. As a long-term trader or investor, I see an opportunity to buy at support. The trader who has been looking at the daily chart has been short. Can both points of view be correct? Absolutely! The short-term trader using the moving average channel methodology has been short. Profit targets have been achieved. The long-term trader or investor using the monthly chart has now switched into "look for a buying opportunity" mode and can switch to a daily chart for timing.
RBT
NOTE: the two indicators in the chart above are a 10 period Simple moving average of the high, an 8 period Simple moving average of the low. The lower indicator is Williams accumulation distribution and a 57 Simple moving average of Williams.

INTC Gap Down Good Opportunity [LONG]INTC looks good long despite short term setbacks.
Technically this looks a good opportunity for me and my risk tolerance.
Definitely room to the downside for afew DCA entries, but happy at this level.
** NOT TRADING ADVICE **

Intel - Oversold. PT: $54 / $56RSI indicator showing that INTC is oversold. We see a reversal to max $54 / $56.
1H RSI @ 16.11.
For educational purposes only.

Intel In A Pullback; Support at $40-45Intel remains in correction after sales report miss. Chips remain the primary issue.
On the price chart it looks like another interesting 30-40% discount. Been the case since 2009.
I see price coming down into wave four. Nice support is at around $40/$45
GH

INTC small upside before correctionINTC wil go up a bit completing W-5 and then correction will occur, expecting to completed by 1st week of Nov
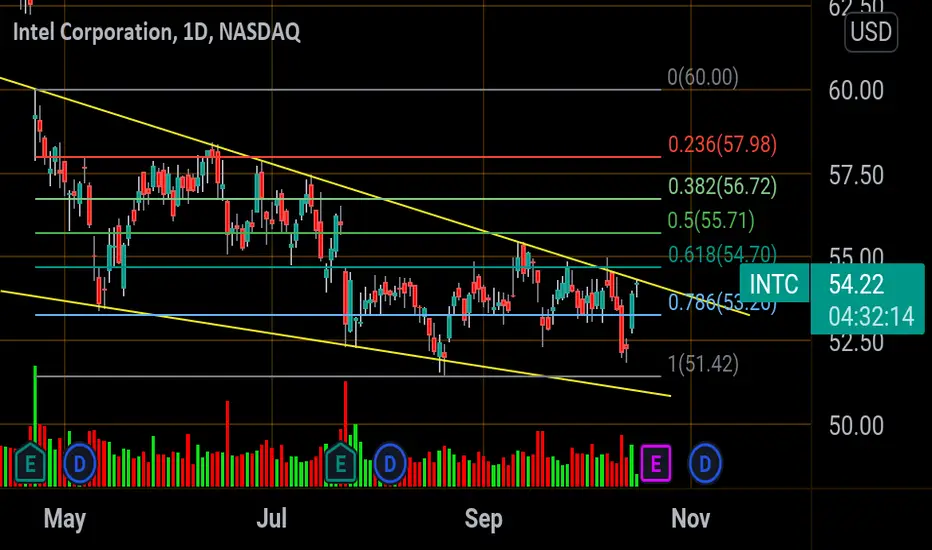
Intel buyIntel made a higher high but then pullback hard to make aa downtrend. That pull back downtrend finally broke with a bullish strong engulfing candle all being on the weekly timeframe. The high push hit the .618 fib level on the break of the downtrend pull back. Price is currently sitting along a weekly uptrend as well. Broke out of consolidation on the daily timeframe. entry price I'm looking for 55 & exit point would be around 75 And stop loss would be 47

INTC - Provides Intel on the State of Affairs in MANUAfter a run ahead of EPS, the 46.07 ended up another Ghost in the ALGO Machine.
EPS for Intel, another Disasater after FAB MANU ASML's ugliness, Lucky for ASML
the Dippers were all too anxious to Bid it back up erasing 1/2 its losses from
805.
Earnings Season has added more complexity to the Mix.
NQ made a run for the top of the Range @ 15513/17 - only to unload to its
Prior close by ZERO.
It gave back all the gains on INTC... all of them.
These are the challenges to EPS, volatile and setting up for the unseemly news
from Chips. Today's Intel Dip buyers were dunked to the 52.50 Level on the DOM,
the scene of prior High Crimes and Felonies.
As Semi's continue to report, they will continue to reveal Q3 was indeed a disaster,
lots of Fudge, no Walnuts.
Today's EPS was TECH heavy, tomorrow is Freaky Friday - the most overused Day
of the Week to Crush the VX Complex.
With the 400 Ticks of CF ahead, it will, no doubt be challenging.
Trade Safe, it is very dangerous at present.
Timeframes are in Conflict, complete conflict. Weeks end will begin to resolve this
when we see where the Weekly Candle closes. Last Week's close = 15134.50.

Intel | Fundamental AnalysisIntel will have another chance to breathe life into its dropping stock when it reports its third-quarter results on Thursday, Oct. 21. The chip giant's stock has lagged the broader market this year, though it started brightly, as problems in the personal computer and data center business intensified due to stiff competition from companies like Advanced Micro Devices.
Let's take a look at what we can expect from Intel's upcoming quarterly report and decide if the company can show strong enough results and outlook to tilt investor sentiment in its favor.
Intel's second-quarter results, released in July, were better than expected. The company's adjusted earnings of $1.28 per share rose 12% year-over-year and easily beat Wall Street's forecast of $1.06 per share. The company's earnings were up 2% from a year earlier to $18.5 billion. Moreover, the corporation also upgraded its full-year earnings by $1 billion to $73.5 billion and raised its earnings per share forecast by $0.20 to $4.80 per share.
But that wasn't enough to change investor sentiment, because a closer look reveals that competition is becoming a real thorn in the chipmaker's side. For example, the company expects the third-quarter adjusted gross margin to be 55%, a significant drop from 59.2% in the second quarter. At the same time, Intel's data center group revenue fell 9% year over year to $6.5 billion as both shipments and average purchase prices declined.
A 6% year-over-year increase in client computing group revenue to $10.1 billion was accompanied by a drop in notebook and desktop processor prices. More specifically, notebook ASP prices were down 17% year-over-year and desktop ASP prices were down 5% - the result of Intel's strategy to lower its processor prices in order to sell more units.
Thus, Intel needs not only to show good results but also to demonstrate that it can again stand up to AMD, gaining more and more market share. Intel's full-year forecast, however, does not indicate that this will be the case. The company's fourth-quarter revenue is forecasted to fall 8.6 percent year over year to $18.25 billion, and earnings are expected to fall to $1.01 per share from $1.52 per share a year ago.
By comparison, Intel may do much better in the third quarter, with revenue and earnings expected to be flat year-over-year. All of this designates that Intel stock may lag the broad market for the rest of the year. But investors shouldn't lose sight of the fact that some favorable factors on the horizon could breathe life into the stock in 2022 and beyond.
Wall Street expects Intel's sales to decline to slow in 2022 and its earnings to remain at 2021 levels. In 2023, analysts expect Intel to regain its momentum and increase earnings slightly.
However, don't be surprised if Intel changes its fortunes sooner, as the company intends to step up its product development game. According to the company's development plan, it will move to a 7-nanometer manufacturing process in the second half of 2022. The smaller node size suggests Intel's chips will become more competitive. This is because the transistors in a chip made using a smaller node are more tightly packed together, resulting in better performance and greater efficiency.
The company promises a 20 percent improvement in performance per watt over current-generation chips when it releases processors based on the 7-nm process technology, codenamed Intel 4. Then, in the second half of 2023, Intel plans to release an advanced version of its 7nm chips, which it claims could be 18% more powerful than Intel 4 chips. That will be followed by the Intel 20A architecture in 2024 when the company is expected to produce chips based on the 5-nm node.
All of this suggests that Intel is on its way to consistently improve its manufacturing process, which should help it bridge the technology gap with AMD. So Intel may eventually regain its spirit and become a profitable investment, but investors will have to wait patiently for this turnaround, as it may take some time. The good thing is that patient investors willing to bet on Intel's transformation can buy this technology company's stock at just 12 times its forward earnings, which could prove to be a good deal in the long run as its fortunes begin to rise.

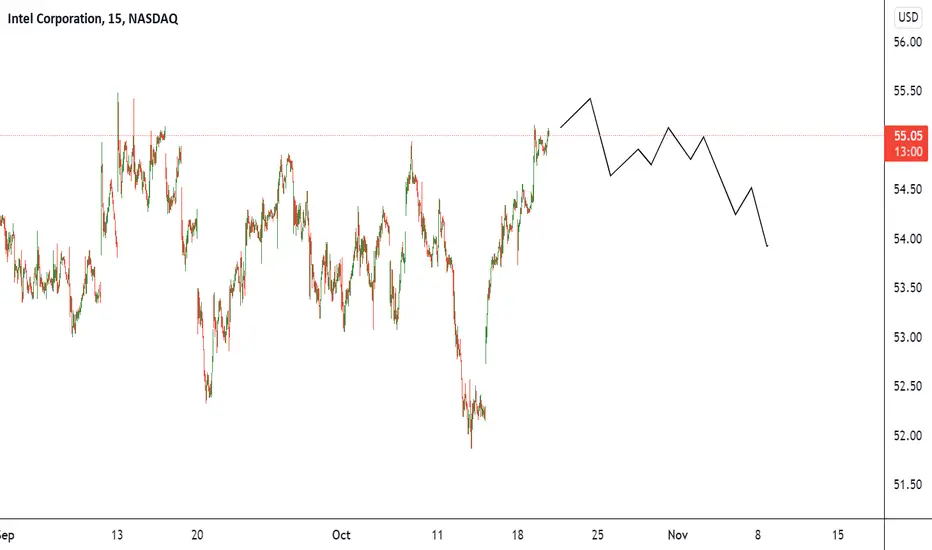
Intc earnings previewBeen trading in this fallen wedge since the summer.
There is a lot of price action in that 53-54.50 area.
Intc actually touch wedge resistance today and got rejected. It bullish here and if there is a breakout coming they'll definitely save it for earnings.
If it does breakout I think we're are headed back to 60$
if there is a rejection then a possible pullback to 51$ is at play
INTC StrategyPrice action currently in descending triangle. Risk of breakout to the down side. Regardless, price is still undervalued, trading lower than the Yahoo Finance 1yr price Target , DCF and Earning Multiple estimates

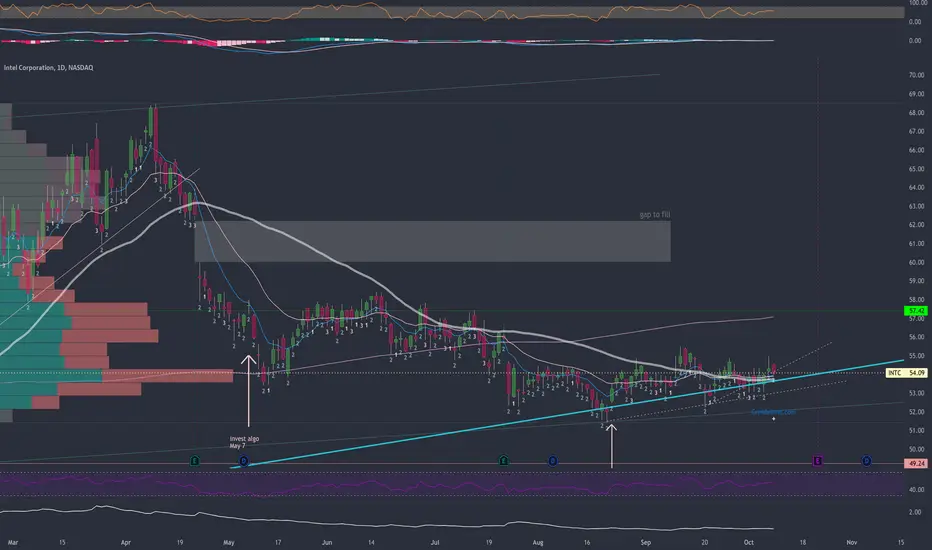
INTC - stealth strengtheningINTC should move higher after it clears the current levels. Next resistance is the 200ma, but I believe it's true target is to fill the gap by earnings.

INTC - STOCKS - 11. OCT. 2021Welcome to our Weekly V2-Trade Setup ( INTC ) !
-
4 HOUR
Great market structure..
DAILY
Looking for more upside price action!
WEEKLY
Expecting a price turnover in most tech stocks..
-
STOCK SETUP
BUY INTC
ENTRY LEVEL @ 53.68
SL @ 53.03
TP @ Open
Max Risk: 0.5% - 1%!
(Remember to add a few pips to all levels - different Brokers!)
Leave us a comment or like to keep our content for free and alive.
Have a great week everyone!
ALAN

INTC Daily : Bearish but some indications for a change...INTC in daily : it s in bearish trend, but a range phase starts at 23 July.
There are some goods signals to change this bearish movement, but for the moment it s preferable to stay out and wait for the best moment: leave the range by superior limit, and the components ichimoku became bearish.
NB : Resistances Majors at 56 and 61

$INTC - gimme that baseINTC is setting up a nice base.
I have alerts for $55 to add. Right now I am holding the right number of commons for me.
If the base completes, I think we go into cup and handle pattern. it's holding fairly steady with all the SPY whiplash over the last few weeks.
Worth a watch.
LongIntel seems to have made progress in the energy consumption of the new CPU in the upcoming alder Lake 12. The graphic display adjustment seems to have been completed, which has been adjusted around 0.618 for some time. It is expected to start three waves and rise for a period of time. Intel has been underestimated recently. After driving away the previous CEO, it seems to be back on track and begin to pay attention to technology and technology.

INTC: Buy orderAll trade in sell order/buy order, might not trigger, cancel if the price has run too far.

Intc H&SHeaded back to 51.50 with this H&S .
I'd look for a bounce There which would be bottom of this channel..
All of the chip sectors have loss there support (Smh, Soxx,Soxl) ... this could get ugly if 51$ doesn't

Bullish Divergence for IntelA sign of a trend change. From here I think we'll try to fill the gap.
Do your own DD - not trade advice.
Good luck!

Gap fill for earnings (before or after?)Gap will be filled on the daily. "When" is the question.
Thoughts?
Good luck to all.

INTC - ShortI am shorting INTC
Sitting well below its 200DMA
At the top of a 60-day descending channel
At the top of a 30-week descending channel
All sorts of moving average resistance above (10 day, 50 day, 200 day, 10 week, 30 week)
To this new trader, this stock looks ugly.
Target: 47.50ish (will sell 1/2 at 51.50)
Stop: 54.28 (a close above 50dma)

ABC BullishKind of hard to be bullish on anything after a day like today. On the positive side, a stop would be close by.
INTC was in a small wedge or pennant but fell out today. This could fall further but just does not look like it will go too much lower. But who knows? I suppose the next few days will let us know.
Possible tight inverse head and shoulders.
No recommendation

INTC Daily TimeframeSNIPER STRATEGY (new version)
It works ALMOST ON ANY CHART.
It produces Weak, Medium and Strong signals based on consisting elements.
NOT ALL TARGETS CAN BE ACHIEVED, let's make that clear.
TARGETS OR ENTRY PRICES ARE STRONG SUPPORT AND RESISTANCE LEVELS.
ENTRY PRICE BLACK COLOR
TARGETS GREEN COLOR
STOP LOSS RED COLOR
DO NOT USE THIS STROTEGY FOR LEVERAGED TRADING.
It will not give you the whole wave like any other strategy out there but it will give you a huge part of the wave.
The BEST TIMEFRAMES for this strategy are Daily, Weekly and Monthly however it can work on any timeframe.
Consider those points and you will have a huge advantage in the market.
There is a lot more about this strategy.
It can predict possible target and also give you almost exact buy or sell time on the spot.
I am developing it even more so stay tuned and start to follow me for more signals and forecasts.
START BELIEVING AND GOOD LUCK
HADIMOZAYAN
