INTC trade ideas


INTC Diamond TOP, return to below 56 by 3/19 opexSimple. Diamond top. Rubbish semiconductor name. This will flush hard and fast.
Positions:
62/64 call credit 3/19
59.5/55 put debit 3/19
75x each spread. Let's print max profit.

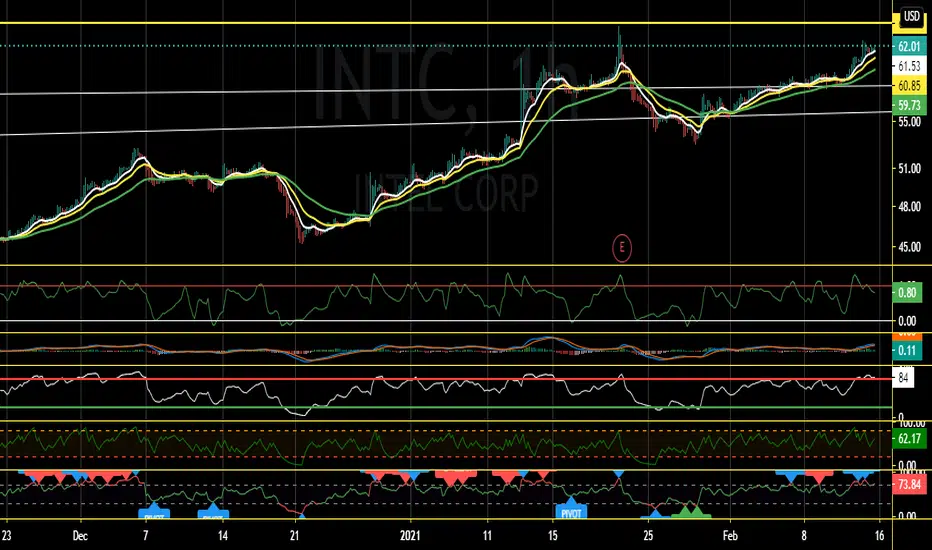
$INTC Diamond Top pattern, negative divergence MACDLooking at $INTC recently they were hit with the news of losing a patent and being fined 2.5bn. The news itself are bad to begin with but looking more in depth I see:
-Diamond top pattern forming on the daily, it looks just as good on the weekly.
-Buying volume has been decreasing while selling volume is increasing even while it was moving up
-MACD is in negative divergence in the daily
Going to be looking at one level at a time but for the measured move of the Diamond top is nearly 20% I doubt it can be reached since there could be any catalysts that could help bring the price up. TA is not exempt from news
Once $INTC breaks below $60 the downtrend can begin to hit the following TPs:
1)$58
2)$55.83
3)$53.9
4) for the movement to be fully completed $INTC would reach near $49
-Focusing of course one level at a time analyzing price action and keeping an eye out for any news that could help keep its current valuation NASDAQ:INTC

Cup and handle in Intel Potential gain:10%
Reward/Risk:2.9
Timeframe: 1-2 wks
I always try to present the charts in a simple comprehensive format to prevent any confusion.
This is just my technical view, neither a fundamental comment,nor a recommendation to trade..!
Please review my track record and calculate the odds for yourself..!
You’re likes and comments encourage me to continue this.
Stay tuned great live stream and quality content videos coming soon..!

INTC Long BuyOn the 1h chart INTC can be seen forming an inverse Head and Shoulders Pattern, or even a Double Bottom pattern. This is a very bullish sign, with the MACD transitioning into the green. If Intel successfully breaks the 63.57 line, it could go long having price targets of:
$66.30 - $67.80 - $70.00
In my opinion this looks like a very safe bull play on INTC. Always remember to buy the dip, thanks for viewing!

Fermenting a giant cup and handle Not too sure if this giant pattern can endure the volatility ahead.
None the less, a giant cup and handle is brewing at the moment,

INTC Possible Fall?Check out the history of this chart. INTC can never stay above the $61 to $66 zone for too long. There has always been a drop back down to $45.10.
INTC chart is printing a bullish triangle but it did the same thing starting August of 2019 and it looks like the same pattern almost.
Will keep my eye on INTC during the week for a good entry. The goal would be to exit before the earnings call on 4/29.
I'm expecting to see the chart shoot up possibly 7 points then follow the usual pattern.
Check the chart and form your own opinion, this is what I personally see.
Entry $60-$66
Exit $50-$46
Possible gains: 30%-40%
Timeframe: 2- 9 weeks
This is just my view and information for me to track. Form your own opinions!

INTC: looking for a breakout, $70 could be nextGreat chart here for INTC - bouncing off nicely from the $60 level and breaking smoothly (and with strong momentum as shown by the UTO) thru the supply/demand "balance line" at $61.5 ..
we hope to see a continuation of the move up - to be confirmed by a breakout of resistance at $63.5 - maybe today or tomorrow..
Price projection: this was a measured move of $16 from the low set in late Jan of $54 = a short term target of $70 if that move materializes
let's keep watching this chart ... and see if these projections hold.

INTC - H chartThe hourly close below the support 60.75, the double top pattern is confirmed, and the target becomes 158.15
first PRZ from 58.50 to 58.15
second PRZ from 57.55 to 57.30 Potential
PRZ = Potential Reversal Zone

INTC INTC- Just had a golden cross on the daily chart (50 MA crossing above the 200 day MA); Cup and handle on the daily scale; breakout from here can take it to $72, just below 75.75, a multi-year resistance of a multi-year bowl/cup. Biden admin reviewing semiconductor/REE/etc supply, rumored to be signing an exec order to fuel the US semiconductor industry soon.

Intel - 4 possible harmonic patternsIntel has formed a bullish Crab at the end of October, followed by a bearish Shark in January. After returning to the upward trend, it has recently bounced off from the resistance level at around $62.50 (red rectangle).
However, if it breaks that resistance line, we have multiple possible harmonic formations that can form above:
Bat at $64-$66
Alternate Bat at $69-$72
Crab at $74-$71
or even a Butterfly at $78-$75
Around $59, we have a support line (green line).
There is a lot going on in this chart, so here is another one without harmonic predictions:
All the formations use 5% error margin.


Intel - bright future aheadJust buy every dip and you will retire like a boss.
Company is great example of inefficient market - their CPU technology is one of the best and it is a free cash flow generating machine.
Deep otm calls with 80$ strike for 2022 look tasty because of cheap IV.

INTC OPTION PLAY UPDATE (Original was Feb 4)Here is an update from the previous option analysis.
Look below at the previous published idea on INTC

Big Gains On Intel 2021? Hard To Say!With the chatter over US supporting semi-conductor manufacturers, looks like Intel could be ready for another massive generational leap.


INTC - PUTS Options REAchedBeautiful execution price targets met easily and fast.
Great rejection where you could of grabbed OPTION CALLS contracts
More to come
* Well meet again* At&t chart drop tomorrow. Currently bearish


INTC Wave 5Intel Weekly Timeframe
Demand Zone: $56.75- $57
Supply Zones: $61 (Gap Fill), $62.50-$64.00
Breakout of long WXY correction. Foreseeable good news long-term with four new processors coming into the market. Alternative wave count: Y wave can be treated as ABCDE triangle.
