Is Meta The Most Undervalued Stock In The Magnificent 7?In a recent post on key investment trends for the next decade, we highlighted the addictiveness and pervasiveness of social media as a critical long-term shift. Today, we're buying Meta Platforms NASDAQ:META which we believe represents an exceptional investment opportunity.
The Financials
META's recent financial performance has been stellar. The company has maintained 20%+ year-over-year revenue growth for most of the last two years – impressive for a business generating nearly $50 billion quarterly. Even more compelling is bottom-line growth, with net income increasing approximately 50% year-over-year.
This growth is underpinned by META's robust margin profile, which has strengthened considerably since 2022. We attribute this performance to the company's powerful network effects across Facebook, Instagram, WhatsApp, and Messenger – platforms that effectively capture user attention and provide advertisers with compelling ROI.
The Valuation
What makes META particularly attractive right NOW is the valuation. We consider it the most competitively priced among the Magnificent 7 stocks. With the exception of Google, META offers the most favorable metrics on P/E, EV/EBITDA, and P/S ratios. When factoring in growth expectations, META's PEG ratio actually comes in below Google's.
Historically, META is trading at or below its long-term average multiples – with its P/E ratio currently in the lower standard deviation band.
Overall, we believe META's combination of robust growth, significant margins, and attractive multiple make it the most undervalued Magnificent 7 stock. In a choppy market, we rate the stock a "Strong Buy".
META trade ideas

This is a fragile recovery within a technically damaged chartMeta Platforms Inc. (META) — Technical Analysis
Timeframe: 1-Hour
Current Price: $546.45
Trend Bias: Intermediate-term Bearish, Short-term Reversal Attempt
Price Action & Structure
Downtrend from March to mid-April:
META has been in a clear and sustained downtrend, characterized by lower highs and lower lows. Price consistently failed to break above prior resistance levels, confirming seller dominance.
Capitulation & Bounce (mid-April):
The sell-off intensified into mid-April, where META appears to have formed a temporary bottom around $485–$490, aligning closely with a support zone (marked by the red line at $479.76).
Recent Recovery:
The stock has since shown signs of short-term strength, bouncing approximately 12% off the April lows. However, this move currently resembles a bear market rally rather than a true trend reversal.
Key Levels
Resistance:
$582.60 (Pre) – Historical pivot level; potential rejection zone.
$613.73 – Structural resistance and supply zone. Confluence with prior breakdown point.
$641.63 – $657.80 – Major resistance range. Represents previous distribution zone and failed breakout area.
Support:
$546.00 (Current level) – Price is hovering just above minor structure but remains vulnerable.
$479.76 – Last-ditch structural support; breakdown below opens risk to lower $400s.
Volume spike near the “E” suggests earnings reaction was a key turning point — important to monitor how price holds above this level.
Volume & Momentum
Volume Profile:
Increased volume at the recent low suggests capitulation or accumulation. This could mark the early stage of a base, but it’s too soon to confirm.
Momentum Indicators (Not visible here but assumed):
Typically, RSI/MACD would now be recovering from oversold. However, given the context, momentum is likely neutral-to-slightly-bullish but fragile.
Technical Outlook
Short-term:
META is attempting to recover within a broader downtrend. Watch for price action around $560–$582. If it rejects and turns lower, that would confirm the bear flag or rising wedge pattern.
Medium-term:
The stock must reclaim and hold above $582.60 to gain serious traction. Otherwise, this bounce may serve as a dead cat rally before another leg down.
Long-term Investors:
Wait for either:
A successful breakout above $613.73 with strong volume and follow-through, or
A flush toward $479.76 followed by a clear reversal pattern (e.g., double bottom, bullish engulfing).
Analyst’s Summary
This is a fragile recovery within a technically damaged chart. META must prove this bounce is real by retesting and holding higher levels. Otherwise, sellers remain in control. Patience and discipline are key here.

Meta - The Correction Is Officially Over!Meta ( NASDAQ:META ) is retesting the previous all time high:
Click chart above to see the detailed analysis👆🏻
For more than 7 years, Meta has been perfectly trading in a reverse triangle formation. And just three months ago, Meta once again retested the upper resistance trendline and reversed towards the downside. But with the retest of the previous all time high, this correction is over.
Levels to watch: $500, $800
Keep your long term vision,
Philip (BasicTrading)

META Share Price Rises Cautiously Ahead of Earnings ReportMETA Share Price Rises Cautiously Ahead of Earnings Report
As shown on the Meta Platforms (META) chart, the share price rose by approximately 1% yesterday. This movement was supported by the announcement of the launch of the Meta AI app—an artificial intelligence-based application that will function as a personal assistant on mobile phones (similar to Google Gemini).
In a different market environment, the news might have prompted a more positive reaction. However, traders currently appear to be exercising caution, as Meta Platforms (META) is due to report its quarterly results after the close of the main trading session today. According to media reports, expectations include:
→ Revenue in the range of $41.35–$41.5 billion, which implies a year-on-year increase of roughly 13–14%.
→ Earnings per share (EPS) between $5.22 and $5.29, indicating a 11–12% rise compared to the same period last year.
Key Factors in Meta’s Quarterly Report
The following areas are likely to have a significant impact on META's share price in the wake of the report:
→ Advertising business , Meta’s primary revenue stream (around 96%). There is a possibility that US tariff policies could prompt major Chinese advertisers—such as Temu—to reduce their advertising spend in the United States.
→ Investment in Artificial Intelligence (AI) and Augmented Reality . Market participants may revise their valuation of the stock downwards if there are lingering concerns over the long-term return on these investments.
→ Forward guidance on revenue and earnings for the next quarter and full year 2025. These forecasts will carry particular weight in an environment of elevated uncertainty linked to US trade policy.
Most Wall Street analysts maintain a “Buy” rating on Meta shares. However, some have lowered their price targets in April, noting that the stock has lost roughly a third of its value since its all-time high in February.
Technical Analysis of Meta Platforms (META)
Price movements earlier in 2025 continued to trace a rising trend channel (shown in blue), with a run of 19 consecutive days of gains in February following upbeat news. However, this trend channel appears to have lost relevance at this stage.
The psychological level of $500 now offers strong support, while the $585 level has turned into resistance. It is reasonable to expect that the earnings report could trigger heightened volatility and a test of one of these key price levels.
This article represents the opinion of the Companies operating under the FXOpen brand only. It is not to be construed as an offer, solicitation, or recommendation with respect to products and services provided by the Companies operating under the FXOpen brand, nor is it to be considered financial advice.

META watch $545-549: Resistance to End Bounce unless strong BullMETA struggling with anti-trust case and AI spend factors.
Currently up against a key Resistance zone $545.51-549.38
If it dips then watch solo fib at 532.20 or zone 504.44-508.71
.
Previous Analysis calling $489 as possible bottom:
"Genesis Sequence" that has caught every major turn:
===========================================================

META Platforms 1H at the END of Bearish Trend Hammer SpottedMETA Platforms 1H at the END of Bearish Trend Hammer Spotted

Meta: Is the Plunge Inevitable?Despite its vast reach and market presence, Meta Platforms faces significant and compounding challenges that suggest a potentially turbulent future. While appearing dominant, the company is increasingly vulnerable to external pressures stemming from legal, regulatory, and competitive fronts. These growing headwinds threaten to erode its financial stability and alter its fundamental business model.
A critical area of concern involves the human cost of content moderation. Meta faces multiple lawsuits in Africa, alleging severe psychological harm to moderators exposed to disturbing content. These legal actions, particularly in Ghana and Kenya, argue that Meta bears responsibility for the well-being of these outsourced workers, citing inadequate support and exploitative conditions. A loss in these cases could set costly precedents, forcing Meta to significantly invest in or restructure its global content moderation operations and potentially face substantial liabilities.
Simultaneously, Meta confronts escalating regulatory action, particularly in Europe. Recent significant fines from the EU under the Digital Markets Act highlight regulatory intent to control how tech giants handle user data and maintain market dominance. These penalties, including a substantial fine over its "consent or pay" model and a previous one for unfair trading practices, signal a global trend towards stricter oversight that could constrain Meta's core advertising business model. Adding to this pressure is the ongoing US FTC antitrust trial, which seeks to unwind Meta's key acquisitions of Instagram and WhatsApp, citing anti-competitive practices. The potential forced divestiture of these highly lucrative platforms represents an existential threat, as Instagram alone accounts for a significant portion of Meta's advertising revenue.
These intertwined legal and regulatory battles, combined with intense competition in the digital landscape and the uncertain return on large investments like the Metaverse, create a challenging outlook for Meta. The cumulative effect of these pressures could significantly impact the company's profitability, market share, and public perception. Navigating this complex environment requires Meta to address these fundamental issues effectively, or face the increasing likelihood of a substantial downturn.

The downfall of METAMETA
Current Price: $465.20
1-Month Move: +4.8% (from $443.90)
1-Year Move: +35.7% (from $342.80)
Year High/Low: $527.30/$328.50
Technicals:
RSI: ~67.4 (nearing overbought)
Above 20-day MA, slightly below 50-day MA, above 200-day MA (short-term rally in a longer uptrend)
Options Data:
IV Rank: 85th percentile (high premiums)
Put/Call Ratio: 1.15 (bearish skew)
Max Pain: $450.00
High OI: $460 puts, $470 calls
Historical & Model Insights
Historical Move: META averages ~14.5% post-earnings, with 5/12 quarters showing downside.
IV Crush: Expect 30–40% IV drop post-earnings, so time exits carefully.
Outlier: Llama/Meta sees bullish potential from call activity and AI-driven ad growth, but bearish signals dominate.
Trade Setup
Strategy: Single-leg, naked put (bearish, defined risk)
Instrument: META
Direction: PUT
Strike: $460.00 (premium $0.72, fits $0.50–$1.00 target band)
Expiry: 2025-05-02 (first weekly post-earnings)
Entry Price: $0.72
Entry Timing: Pre-earnings close (2025-05-01)
Profit Target: $1.44 (~100% gain)
Stop Loss: $0.36 (~50% loss)
Confidence: 65%
Expected Move: ±$68.20 (~14.66%)

Meta Platforms (NASDAQ: META) Receives Analyst UpgradeMeta Platforms (NASDAQ: META) is set to report first-quarter 2025 results on April 30. Ahead of the release, the stock is trading at $532.16, down over 18% year-to-date. Concerns about a pullback in ad spending and rising AI infrastructure costs had weighed heavily on investor sentiment. However, robust engagement trends and a notably cheaper 16x EV/EBIT valuation have prompted a shift in outlook. The stock has been upgraded from Sell to Hold.
Despite macroeconomic challenges and regulatory fines from the EU, analysts maintain a positive long-term view. Benchmark’s Mark Zgutowicz cut his price target to $640 from $820 but reaffirmed a Buy rating. He highlighted Meta’s long-term strength in U.S. digital ad markets and its disciplined capital allocation.
Similarly, Stifel’s Mark Kelley reduced his target to $628, citing cautiousness in the e-commerce and subscriptions space. He acknowledged market discomfort reminiscent of the COVID-19 era.
Meanwhile, Monness’s Brian White maintained a Buy rating with a $775 target, projecting Q1 revenue of $41.73 billion and earnings of $5.54 per share. Analysts, on average, expect EPS of $5.24 and revenue of $41.3 billion, suggesting double-digit growth. The stock holds a Strong Buy consensus from Wall Street. Out of 46 analysts, 42 rate it Buy, three Hold, and one Sell. The average price target of $705 implies a potential 35.5% upside from current levels.
Technical Analysis
META has rebounded sharply off a key ascending trendline support that dates back to April 2024. The recent recovery from around $475 coincided with the ascending trendline. The price has been bullish overall, as seen from the 200-day moving average at $408.64.
Price is now about to reclaim both the 100-day ($549.11) and 50-day ($601.58) moving averages. The chart indicates a possible near-term pullback followed by a push toward the $740.91 high. Volume is currently at 44.25 million shares, suggesting rising interest.

META Screaming CAUTION!The hardest thing is to call a short in a recession-proof stock, especially in the tech space. However, only so many dollars are available in the advertisement space, and it can't go up forever. Make this excuse at any price.
As such, I rely on the chart screaming CAUTION!
Again like most of my trade setups, this is a simple trade.
Bulls should take their profits and smile.
Bears short as high as possible with the internet to short more should it form a double top.
The chart has spoken. Like it or not.
Remember I am a macro trader so don't expect tomorrow to play out. My trades take time but have much bigger moves. ;)

META Looks Ready to Explode — Breakout?Here’s my thought process going into META this week — trying to explain it simply like how I’d talk through a chart in a livestream.
Starting from the Daily timeframe, META just broke above that stubborn trendline that’s been pressing down on price since February. After earnings, price held strong — no gap down, no heavy selloff — and the candles we’ve seen since look more like a coil-up rather than a breakdown. MACD and Stoch RSI are both curling up with strength. This tells me bulls aren’t just in control — they’re charging with momentum on their side.
Now dropping to the 1-hour chart, we can clearly see how META exploded out of the recent chop range. The rally came with heavy volume, and we’re now sitting at the 582 zone — right below the GEX heavy resistance wall near 590–600. That’s the next big fight. But what’s interesting is that dips are getting bought fast — higher lows are forming and even intra-hour candles are trending clean above 9 EMA.
GEX analysis (Options flow sentiment):
From the GEX chart, there’s a clear cluster of positive call pressure above 580, and the highest net positive exposure is around 600 — that’s likely the magnet if we keep trending. On the flip side, the PUT support is far lower around 500, meaning dealers aren’t heavily hedged for downside, which typically allows more breathing room to the upside.
Also worth noting: IVR sits at 46.6 with IVX dropping slightly — suggesting option premiums haven’t fully caught up to this breakout. That’s bullish for long calls, and maybe even a short put spread strategy if we continue holding above 575.
How I’m trading this:
If META confirms above 585 with momentum, I’m eyeing a potential push toward 590 → 600 this week. If we consolidate here and fail to push through, I’ll watch 570–575 as support for a pullback buy.
Option setup idea
* Long Calls targeting 600 (preferably 2–3 weeks out)
* Or Bull Put Spread using 575/570 strikes if it retests support and holds
Final thought:
With Trump reportedly meeting with investors this week, big tech sentiment could get a macro jolt. META is already showing technical leadership — if the news cycle gets supportive, this breakout might run faster than expected.
Disclaimer: This is for educational purposes only, not financial advice. Always manage your own risk and confirm your setups.

META (Facebook) | Long Setup | Strong Earnings | (May 2025)META (Facebook) | Long Setup | Strong Earnings & Growth Outlook | (May 2025)
1️⃣ Insight Summary
META has been in a correction since February, coinciding with macro shifts like Trump’s re-election. However, recent earnings and long-term financial projections point to renewed strength.
2️⃣ Trade Parameters
Bias: Long
Entry Zone: Around $550
Stop Loss: $476
TP1: $625
TP2: $680
TP3: $739
Final Target (Stretch Goal): $905
Partial Exits: TP1 and TP2 will secure gains early, while the rest rides momentum toward higher levels.
3️⃣ Key Notes
📈 META reported strong earnings recently, and forward guidance through 2028 looks bullish—both EPS and revenue are projected to rise.
💡 Financially, it’s solid:
• Revenue: $165B
• Net Income: $62B
• Free Cash Flow: $50B
• Debt: ~$50B
• Beta: 0.32 (less volatile than the market)
✅ Healthy cash flow and growth outlook make META attractive long-term.
📊 Technically, we're at a resistance area, and the setup aligns with broader S&P 500 structure. Waiting for a clean confirmation around $550 will be key.
4️⃣ Follow-up Note
Watching closely for a breakout above resistance or potential retest of the $550 zone for entry. Will update the idea if price structure changes significantly.
Please LIKE 👍, FOLLOW ✅, SHARE 🙌 and COMMENT ✍ if you enjoy this idea! Also share your ideas and charts in the comments section below! This is the best way to keep it relevant, support us, keep the content here free and allow the idea to reach as many people as possible.
Disclaimer: This is not financial advice. Always conduct your own research. This content may include enhancements made using AI.

Will META Rebound or Decline? Trading Insights for Next Week
- Key Insights: Meta Platforms Inc. currently faces bearish sentiment amid
broader tech sector underperformance and regulatory headwinds. However, its
attractive valuation, strategic focus on AI, and dominant position in
digital advertising suggest potential for long-term growth. Investors should
be cautious due to economic slowdowns affecting ad revenue and ongoing FTC
antitrust scrutiny. Tactical opportunities may arise depending on how META
approaches identified support and resistance levels.
- Price Targets:
Next week targets (Long Position):
T1: $520 (+3.5%)
T2: $541.65 (+7.8%)
Stop levels:
S1: $495 (-1.5%)
S2: $482 (-4.1%)
- Recent Performance: META has been among the weaker performers within the tech
sector, reflecting broader market headwinds and sell-offs in mega-cap
stocks. Its current price of $502.31 sits near a significant support zone at
$500. Although its recent price action suggests volatility, META remains
confined within a consolidation zone between $480 and $541. The tech
sector’s struggles contrast with gains in safer asset classes, as investors
shift toward havens like utilities and precious metals.
- Expert Analysis: Analysts remain cautiously optimistic about META despite its
regulatory headwinds and economic challenges. Its valuation at 16x forward
earnings is relatively low compared to peers, making it attractive from a
value perspective. Morgan Stanley maintains an overweight rating,
highlighting confidence in META’s AI initiatives and digital advertising
growth potential. However, reduced price targets and concerns over ad-
revenue sensitivity highlight vulnerabilities in META's short-term outlook.
- News Impact: Regulatory scrutiny from the FTC, along with CEO Mark
Zuckerberg’s testimonies, is a key overhang for META. Additionally, economic
slowdowns and inflation concerns are impacting advertising-driven companies
like META, with broader tech sentiment dragging on its performance. Morgan
Stanley’s revised price target reflects tempered growth expectations but
maintains optimism for META’s strategic initiatives. Diversification into
other sectors, such as rising commodities like gold and silver, could help
investors mitigate META's near-term risks.


META : A+ Setup Analysis and Entry TargetsIn this video, I share my analysis on Meta. You get the full overview of how I find my trade setup and entry points.

META Q1 EARNINGSMeta reports earnings today. The stock is positioned between two possible EPS outcomes. If the company reports strong results and achieves an EPS of $5, it could break through the intermediate resistance level. If the results are not favorable, the stock may retest the double bottom.

META - Another great earnings, allowing us to collect value?Hi guys ,we would be looking into our analysis for META stock.
Meta Platforms Inc. has demonstrated robust financial performance, underscoring its strategic investments in artificial intelligence (AI) and digital advertising.
Strong Financial Performance
In Q4 2024, Meta reported revenue of $48.39 billion, marking a 21% increase year-over-year. Net income surged by 49% to $20.84 billion, with diluted earnings per share (EPS) rising 50% to $8.02. The company's operating margin improved to 48%, up from 41% the previous year, reflecting enhanced operational efficiency.
AI-Driven Advertising Growth
Meta's advancements in AI have significantly bolstered its advertising capabilities. In Q3 2024, advertising revenue grew by 18.6% year-over-year, reaching $39.89 billion. The integration of AI technologies has enhanced ad targeting and delivery, contributing to this growth.
Our Confidence
Overall analysis maintains a bullish outlook on Meta's stock, with an average price target of approximately $634, suggesting a potential upside of around 17% from current levels. The company's strategic focus on AI and its strong financial results support this positive sentiment.
In summary, Meta's strong earnings report, driven by AI advancements and advertising growth, positions the company favorably for continued success in the evolving digital landscape.
📌 Trade Plan
📈 Entry: 550
✅ Target: 630 - below the ATH to give an achievable destination
❌ SL: 480 - below the support zone to protect the trade

Meta Long price tapped weekly demand
sesoanlity is coming to pisitive in near future
underlavalued against bonds
price should break trendline on daily retest demand and off to go
Trade Safe


META Weekly Options Trade Plan 2025-04-16META Weekly Analysis Summary (2025-04-16)
Below is a synthesis of the analyses from all the models and a corresponding actionable trade idea:
──────────────────────────────
Comprehensive Summary of Each Model’s Key Points
• Grok/xAI Report – Noted that META’s price is well below its moving averages with a bearish MACD and near oversold RSI on the M5 chart. – Emphasized downside pressure with heavy put volume and a max pain at $540. – Recommended a bearish weekly trade with an emphasis on buying a put option—in their case, the $485 strike.
• Claude/Anthropic Report – Highlighted sustained downtrend (–13% over 5 days, –22% over 30 days) and all key EMAs trending lower. – Confirmed technical weakness with bearish MACD crossovers and RSI readings on both 5‐min and daily charts, despite a hint of potential short-term bounces. – Suggested buying a put option (their primary suggestion centered around a $480 put, though they mention liquidity and risk using nearby strikes).
• Gemini/Google Report – Noted that although META’s price touched lower Bollinger Bands and the RSI is near oversold territory, the dominant trend is bearish. – Confirmed heavy put open interest and significant recent declines. – Proposed a weekly trade buying put options near the $482.50 strike (ask ~$0.55) as the best balance between cost and risk/reward.
• Llama/Meta Report – Reiterated that technical indicators (price, EMAs, MACD, and Bollinger Bands) show a moderately bearish environment. – Favored the $482.50 put option with an ask around $0.55 because it fits within the ideal premium range and provides sound liquidity. • DeepSeek Report – Pointed to a sustained downtrend with consistent bearish signals on both the technical and sentiment fronts. – Recommended a weekly bearish put trade—selecting closely between a $485 or $482.50 strike—with defined risk targets.
────────────────────────────── 2. Areas of Agreement and Disagreement Between Models
• Points of Agreement – Every model sees META trading in a moderately bearish environment, with price action well below key moving averages and bearish MACD/Rsi signals. – All reports confirm that the short-term sentiment (supported by high volatility measured in VIX and heavy put open interest) leans toward further downside. – All agree that a weekly options trade is appropriate—and each favors a put option trade with strikes in the low-to-mid 480s range. – Liquidity and risk/reward are key, with the models collectively favoring strikes whose premiums fall in or near the ideal $0.30–$0.60 range.
• Points of Disagreement – There is a slight difference in strike selection: recommendations ranged between the $480, $482.50, and $485 puts. – Some emphasis was placed on avoiding a near-term bounce (with stop‐losses set at different levels); however, the differing exit strategies are minor and stem mostly from risk tolerance variations rather than a fundamental disagreement on the bearish bias.
────────────────────────────── 3. Clear Conclusion & Trade Recommendation
Overall Market Direction Consensus: All models converge on the view that META’s short‐term outlook is moderately bearish with technical indicators (price below major EMAs, bearish MACD, and relatively low RSI levels) coupled with the high-volatility environment pointing toward further decline.
Recommended Trade: • Instrument: META weekly options • Strategy: Buy single-leg, naked put options • Expiration: Weekly options expiring on 2025‑04‑17 • Selected Option: The $482.50 put (with an ask of ~$0.55) is favored. It offers a premium within the ideal range, and its “distance” of about 5.3% below current price fits a downward scenario. • Entry Timing: At market open • Risk/Reward Guidance: We target roughly a 100% gain (profit target around $1.10) on the premium while protecting with a stop-loss around $0.30 if the premium erodes significantly. • Confidence Level: 70% • Key Risks and Considerations: – A near-term bounce or oversold reversal (as indicated by the RSI and Bollinger Bands) could force a premature exit. – The max pain level of $540, while distant, is noted but considered less significant given the strong technical weakness. – Market volatility remains high; hence, strict adherence to the stop-loss is recommended to limit adverse moves.
────────────────────────────── 4. TRADE_DETAILS (JSON Format)
{ "instrument": "META", "direction": "put", "strike": 482.5, "expiry": "2025-04-17", "confidence": 0.70, "profit_target": 1.10, "stop_loss": 0.30, "size": 1, "entry_price": 0.55, "entry_timing": "open" }
Disclaimer: This newsletter is not trading or investment advice but for general informational purposes only. This newsletter represents my personal opinions based on proprietary research which I am sharing publicly as my personal blog. Futures, stocks, and options trading of any kind involves a lot of risk. No guarantee of any profit whatsoever is made. In fact, you may lose everything you have. So be very careful. I guarantee no profit whatsoever, You assume the entire cost and risk of any trading or investing activities you choose to undertake. You are solely responsible for making your own investment decisions. Owners/authors of this newsletter, its representatives, its principals, its moderators, and its members, are NOT registered as securities broker-dealers or investment advisors either with the U.S. Securities and Exchange Commission, CFTC, or with any other securities/regulatory authority. Consult with a registered investment advisor, broker-dealer, and/or financial advisor. By reading and using this newsletter or any of my publications, you are agreeing to these terms. Any screenshots used here are courtesy of TradingView. I am just an end user with no affiliations with them. Information and quotes shared in this blog can be 100% wrong. Markets are risky and can go to 0 at any time. Furthermore, you will not share or copy any content in this blog as it is the authors' IP. By reading this blog, you accept these terms of conditions and acknowledge I am sharing this blog as my personal trading journal, nothing more.

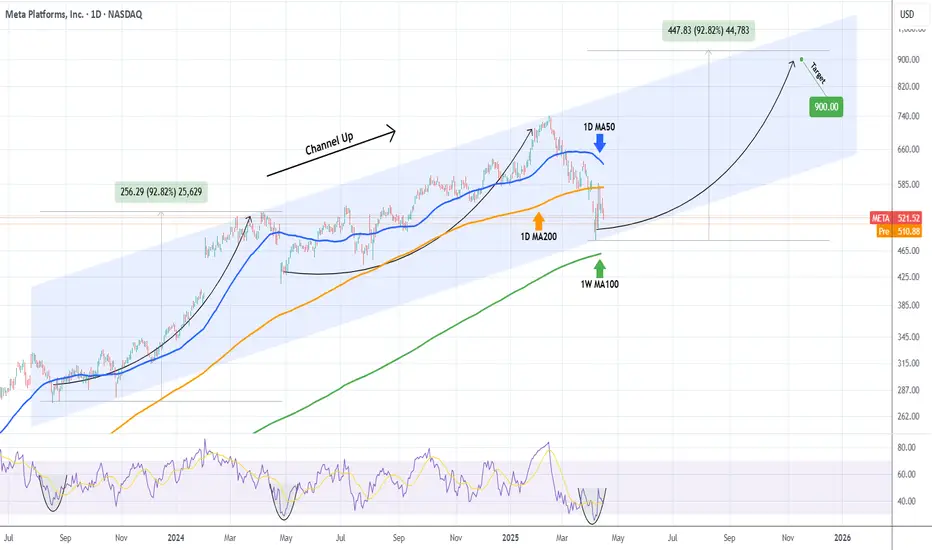
META Slow recovery but $900 possible this yearMeta Platforms (META) had a strong -35% correction in the past two months, dipping even below its 1D MA200 (orange trend-line). By doing so, it reached the bottom (Higher Lows trend-line) of the 2-year Channel Up and rebounded instantly.
The rebound has stopped so far on the 1D MA200 where it got rejected. This keeps the market neutral and the long-term bullish sentiment can only be resumed if the market breaks and closes above its 1D MA50 (blue trend-line). Until then we are neutral but only as long as the 1W MA100 (green trend-line) holds, below it the bearish trend is resumed and the correction can potentially reach -50% to -70%.
If however we close above the 1D MA50, expect a +90% rally, similar to the first Bullish Leg of the Channel Up, slow at start but aggressive after half point. Target $900.
-------------------------------------------------------------------------------
** Please LIKE 👍, FOLLOW ✅, SHARE 🙌 and COMMENT ✍ if you enjoy this idea! Also share your ideas and charts in the comments section below! This is best way to keep it relevant, support us, keep the content here free and allow the idea to reach as many people as possible. **
-------------------------------------------------------------------------------
💸💸💸💸💸💸
👇 👇 👇 👇 👇 👇
Spike RetracedYesterday's spike and the 3 days long lasting rise have been retraced today.
The expectations have risen the past 4 days and we may expect a new test of the March high now at least.

META watch out if market is not completing a V-form
Mark does not look happy....
See that META is now below the MA, since it had the previous behavior of falling like a stone massive amount of percentage, it is more likely to do it again.
Look on this one carefully if you are long.
If the market will not complete the V-Formation, and shoot up, we may see the stock fall again, substantially.
