Using the Second Charts on TradingviewThis tutorial goes over the uses of the very low timeframe features that Tradingview offers, namely the 1 second through to the 30 second charts.
The main advantage to these timeframes is that they permit you to clearly see whether your support and/or resistance levels are being held or are being rejected. This allows you to make a determination much quicker than if you are using higher timeframes. This can make or break your profit and setup and is quite an advantageous tool to utilize if you have access to these timeframe periods.
In addition to visualizing support and resistance breaks/holds, the use of these smaller timeframe charts also allows you to apply methods such as the Heikin Ashi strategy much more effectively and quickly. If you are a scalper, it does add an insurmountable amount of value to your analysis.
Thanks for watching and leave your questions and comments below!
Safe trades everyone!
META trade ideas

Meta Platforms META - Expect lots of price actionBased on after-market price action META has already dropped from about $493 into the gap at about $420. There is room to fall further to the 200 day EMA that coincides with the previous all-time high. We would definitely expect some reaction at that point. There should be a lot of price action at this point since the gap is so large. This is a wait and see situation.

Buy MetaInvesting differs from trading as it focuses on long-term growth and sustainability of assets rather than quick gains. An investment idea involves committing money to ventures, projects, or assets expected to grow in value over time, such as stocks, bonds, or real estate.
Investing requires understanding the fundamental factors that drive growth and stability. It involves detailed analysis of opportunities, like evaluating a company's financial health and potential for innovation, to minimize risk and maximize long-term gains.
META - Short OpportunityVideo says it all! Meta has someroom for a liquidity build after filling the large downside gap.
Happy Trading :)

Prep and Lean 6.6.24ES
Overall conditions quite bullish. It is difficult to be bearish given the VAH is also the HOD, meaning volume & value are backing this move.
No bullish close but a value shift higher, so I can’t really be bearish until acceptance back below the VAL 5326 is found.
Depending on where we open, our best reference would be 5360-5362, the VPOC & spike base.
Open / bid above 5360-5362 targets 5382 / 5391. Take out 5391 targets 5408.
Open / offer below 5360-5362 targets 5336. Take out 5336 targets 5326 / 5317.
NQ
Overall conditions quite bullish.
No bullish close but a value shift higher, so I can’t really be bearish until acceptance back below the VAL 18902 is found.
Depending on where we open, our best reference would be 19049, the spike base.
Open / bid above 19049 targets 19123-19148. Take out 19123-19148 targets 19180.
Open / offer below 19049 targets 18923-18950. Take out 18923-18950 targets 18902.
Stay Frosty!

Meta Platforms - Watch the earnings!Hello Traders and Investors, today I will take a look at Meta Platforms.
--------
Explanation of my video analysis:
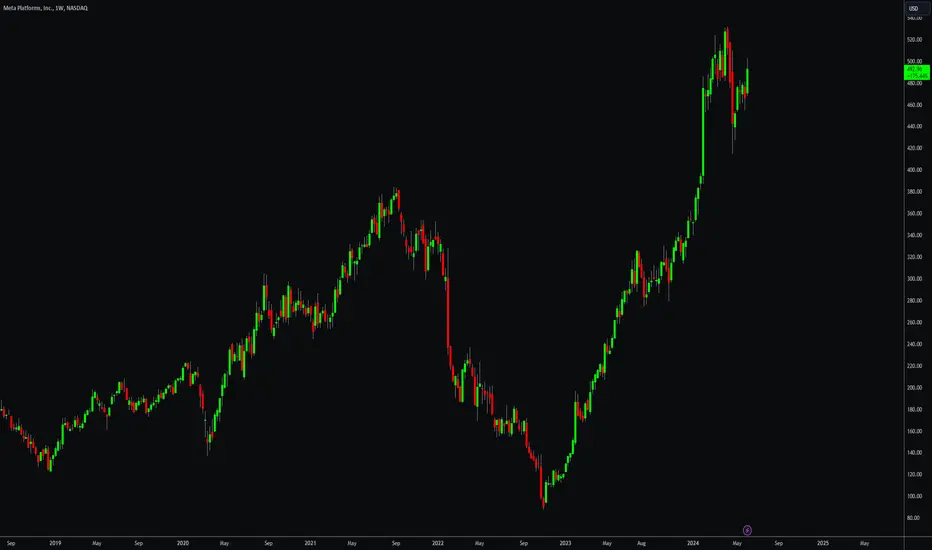
For more than five years Meta Platforms has been trading in a reverse symmetrical triangle formation. We saw the last retest of support back in the end of 2022 which was followed by a decent rally of +450% towards the upside. At the moment Meta Platforms is retesting the upper resistance of the triangle formation so it is quite likely that we will see at least a short term rejection towards the downside.
--------
Keep your long term vision,
Philip (BasicTrading)

$META: long term trend is clearly bullish...A very nice case study for Time@Mode applied to long term charts here...
If you bought NASDAQ:META at any point since it bottomed, you're pretty much golden.
Can hodl this and let it ride towards the long term targets that can take as far as 2028 if patient enough.
Current monthly trend is a good low risk entry, will confirm on close this month for higher confidence in the signal working. For now it seems unlikely for price to crater below $286.79 before the end of January, but it could always happen as a black swan, that's why you wait for signal confirmation if conservative.
Best of luck!
Cheers,
Ivan Labrie.

META - Short term outlook and trade ideaWill definitely be looking to go long here toward the top of orange and potentially even break out of orange toward top of purple. If we do see ourselves getting rejected at orange tapering, that will set us up for an easy short trade down to retest our tapered white algorithm.
As always, let price tell you what it wants to do - don't try and force it's hand because it will win every time!
Happy Trading :)

Meta Platforms (META): Ready for a Correction?We initially set our maximum target at $510, and the price climbed to $531—a difference of only about 4%, which is quite close given the magnitude. We're satisfied with our analysis so far and want to stay within this timeframe.
While it's possible that Waves 3 and 4 haven't fully played out yet, we need to consider that Wave 5 in Meta often tends to be longer. This historical pattern suggests that the current Wave 5 might have extended similarly.
If Waves 5 and (1) are not yet complete, we would need to see the price rise significantly, surpassing $575. Such a move would indicate that the bullish cycle isn't finished, and we might see a further upward spike before a deeper correction.
However, the RSI shows a bearish divergence: lower lows on the RSI while the price chart shows higher lows. This divergence is typically a bearish signal and shouldn't be ignored, as it often leads to price corrections.
Even though we have closed the gap, we believe that a further decline is possible, potentially down to around $384 to complete Wave A. An ideal entry zone for us would be around $306, with a worst-case scenario down to $181. This analysis takes into account both historical price patterns and current indicators to inform our strategy moving forward. Keep in mind even though META seems to be a huge organisation we have seen some bigger pullbacks in the past.

Looking for a bullish swing buy for META!🔉Sound on!🔉
Thank you as always for watching my videos. I hope that you learned something very educational! Please feel free to like, share, and comment on this post. Remember only risk what you are willing to lose. Trading is very risky but it can change your life!

META : Sideways Trend Key Points : NASDAQ:META
1. A symmetrical triangle chart pattern is a period of consolidation,
2. A breakdown from the lower trend line marks the start of a new bearish trend.
3. A breakout from the upper trend line indicates the beginning of a new bullish trend
Resistance - 480
Support - 462
If you need further analysis, please don’t hesitate to reach out. Feel free to contact me if you have any questions or concerns. If I can help in any way, please don’t hesitate to ask.

FB may not be the future of social media but…….FB is looking mighty suspicious as a bullish long term growth target.

META eyes on 489.05 into Earnings: Golden Genesis fib Top or NotThis is a follow-up to my Big PIcture calling for $489 (click)
High Gravity fib has held us in orbit for 2 months.
Just got a retest on the day of Earnings release.
This could mark the top or start next leg today.
Time of this post is BEFORE the release,
chart will not show results until next day.
.
Here is my big picture:
================================================================================================

It's time to take profits on META. Meta Platforms (META) may experience a retracement after a 500% surge since November 2022.
- The price has been rejected at the blue trend line.
- The RSI is crossing below its moving average.
- The trend lines on the 3-Line indicator have crossed bearishly.
If the parallel channel breaks, a downturn is likely.

META: Trend Line (Short Term) key Points
1. Short Term Up trend
480- may act as a resistance. This resistance has to break to continue up trend.
If it fails to break it , a sideways trend may be seen here.

META: symmetrical triangle ( Short Term) / Date: 26.05.24]Key Points: NASDAQ:META
1. A symmetrical triangle chart pattern is a period of consolidation,
2. A breakdown from the lower trend line marks the start of a new bearish trend.
3. A breakout from the upper trend line indicates the beginning of a new bullish trend
Support/Resistance:
480 - may act as a resistance
460 - may act as a support
Notice :
looking for a job
------------------------
Is Your company hiring an assistant day & swing Trader/ assistant technical analyst/ assistant equity analyst?
I am a day & swing trader, freelancer technical analyst & equity analyst. Now, I am looking for a job .
Skills: Chart analysis, Trend identification, Price pattern recognition, important support and resistance levels identification,
Set up trade idea ( long /short),
Set up entry and target price.
Valuation, making analysis report etc...
Experience: 5 years.

Microsoft sellreacting at the resistance line, bearish trend, head and when shoulders patter , breakout to the downside, bearish market structure.

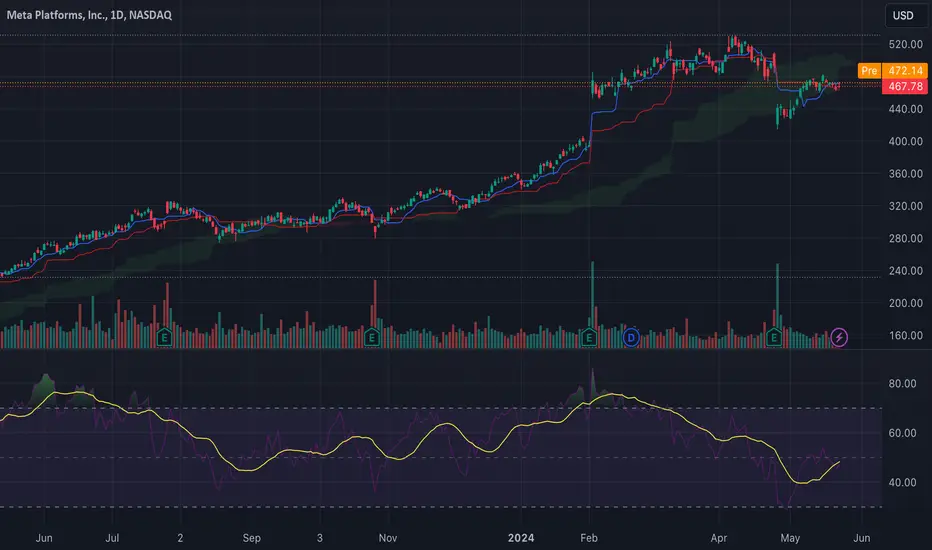
Meta Platforms Set for Explosive Breakout or Major Pullback $Meta Platforms, Inc. (META) closed at $467.78 on May 22, showing a slight increase of 0.68% from the previous close. The current pre-market price is $472.05, indicating bullish sentiment as we approach the trading day. Analyzing the daily candlestick chart, the stock has been trading within a range, exhibiting consolidation around the $460-$480 levels after a significant uptrend observed from January to March 2024.
The 10-day EMA ($469.13) and the 10-day SMA ($471.94) are currently indicating a sell signal.
The longer-term EMAs (100-day and 200-day) at $450.46 and $400.15 respectively, are indicating a buy signal, reflecting the overall bullish trend in the longer timeframe.
The volume analysis shows an average trading volume of 17.84 million over the past 30 days, with the latest trading day volume at 10.08 million. This indicates lower participation compared to the average, which could suggest either consolidation or potential accumulation.
The price is currently trading above the Ichimoku Cloud, which suggests bullish conditions in the longer term. However, the cloud's leading span is starting to thin out, indicating possible future volatility and a need for caution.
Long Position:
Entry: Consider entering a long position if the price breaks above $480 with strong volume. This breakout would signify a continuation of the bullish trend.
Price Target: $520 (based on the previous high and projected bullish momentum).
Stop Loss: $455 (just below the current consolidation range).
Short Position:
Entry: Consider entering a short position if the price drops below $455 with increasing volume. This would indicate a potential reversal or deeper correction.
Price Target: $420 (near the 100-day EMA).
Stop Loss: $480 (to mitigate risk if the price reverses to bullish trend).
Given the current technical setup and market conditions, Meta Platforms, Inc. has the potential to reach $520 within the next quarter if bullish momentum continues. However, if bearish pressure prevails, a decline to $420 is possible, providing a key support level based on historical price action and moving average supports.
Meta Platforms, Inc. presents a nuanced trading scenario with both bullish and bearish indicators. Traders should closely monitor the breakout or breakdown levels mentioned above and adjust their strategies accordingly. The mixed signals suggest the need for a vigilant approach, balancing the potential for gains with disciplined risk management strategies.
Put US stock: META👋Hello Traders,
Our 🖥️ AI system detected that there is an ICT Short setup in META for scalping.
Please refer to the details Stop loss, FVG(Supply Zone),open for take profit.
For more ideas, you are welcome to visit our profile in tradingview.
Have a good day!
Please give this post a like if you like this kind of simple idea, your feedback will bring our signal to next better level, thanks for support!

$META $400 Puts Rebalancing a gap from February earnings. Retrace continuation outside of top side range. +EV

META New rally to $800 started.Meta Platforms (META) is consolidating within the 1D MA50 (blue trend-line) and 1D MA100 (green trend-line) only 3 weeks after it touched the bottom (Higher Lows trend-line) of the 1-year Channel Up.
This is the start of the new Bullish Leg of the pattern, half-way through the accumulation process. Once the 1D RSI breaks above its Lower Highs trend-line, we will have a bullish confirmation signal similar to October 06 2023. Our Target is $800.00, which represents a +95% rise, similar to both previous Bullish Legs of the Channel Up.
-------------------------------------------------------------------------------
** Please LIKE 👍, FOLLOW ✅, SHARE 🙌 and COMMENT ✍ if you enjoy this idea! Also share your ideas and charts in the comments section below! This is best way to keep it relevant, support us, keep the content here free and allow the idea to reach as many people as possible. **
-------------------------------------------------------------------------------
💸💸💸💸💸💸
👇 👇 👇 👇 👇 👇

META x10 to $1600Meta has fully recovered from its 2022 losses, which occurred when investors panicked and sold off shares due to concerns over Zuckerberg's heavy spending on the Metaverse.
The swift V-shaped recovery has transformed Meta into a momentum stock. From a technical perspective, it has the potential to double in value compared to its previous losses.
So, what are the fundamental reasons behind a potential 10x increase? While investors were panic selling over PS2-style graphics, they overlooked what was powering Meta's vision. Meta boasts a substantial arsenal of over 600,000 H100 AI chips, far surpassing any other company in the tech industry.
For context, Tesla only has around 35,000 H100 AI chips, Google has 76K and Microsoft just over 150k. Most of Meta's chips were acquired before the AI boom, and its ongoing orders position it to lead in building out a robust AI infrastructure.
If you're betting on the second generation of AI, it is then crucial to consider who has the most resources. Investors are beginning to recognize that Zuckerberg is a visionary CEO are getting behind him.

[mid-term] META Price Prediction :30% profit expectMETA Price Prediction
Welcome to this updated analysis on META
Let’s get right to it!
This information is to be used for educational purposes only
TRANSPARENCY Strategy
