META H&S can send it skyrocket to $294, unless the MA100 breaksMETA has arguably been one of the hottest, if not the hottest, stocks of the year.
The minor (for its parabolic state) correction since Tuesday has seen it hit the MA100 (1h), which is so far holding.
This has completed a Head and Shoulders pattern, which is technically a bearish structure.
If the neckline but more importantly the MA50 (1h) breaks, we expect the price to invalidate the bearish signal of the H&S.
Trading Plan:
1. Buy if the price closes above the 268.50 neckline and the MA50 (1h).
2. Sell if it closes under the MA100 (1h).
Targets:
1. 294 (Fibonacci 2.0).
2. 250 (the MA200 1h).
Tips:
1. The RSI (1h) has crossed over the MA trendline. This is a short term signal of bullish strength.
Please like, follow and comment!!
META trade ideas

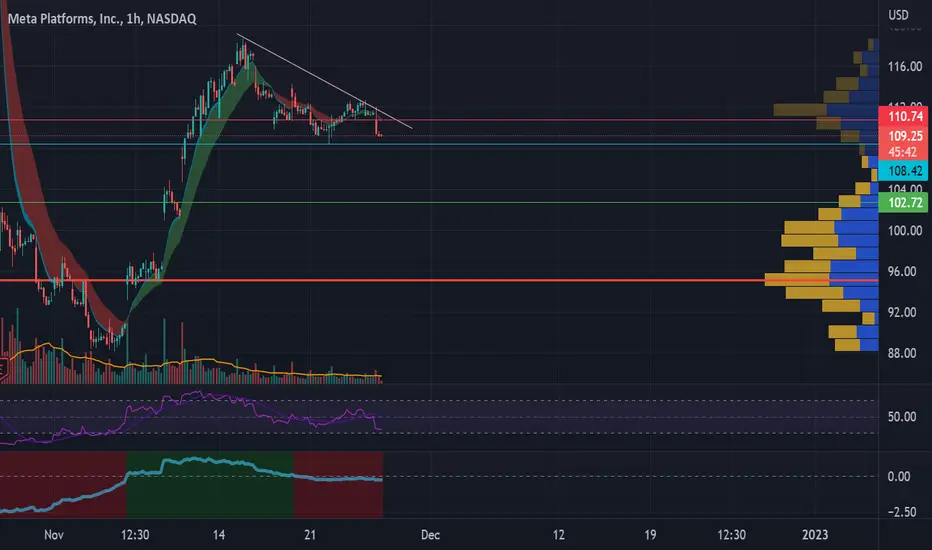
Meta is dancing on the lineLosing that 108.40 line, a quick short will take place to fill the volume gap untill 102.70.
Stop loss at 110.75.
META Stock Price ActionThe bears have taken out the bulls recently, Meta stock might continue to fall using the FVG price action strategy, the next liquidity level seems to be near the 255 area. Banks are long META, long term seems bullish still on monthly chart.

Meta long (1H)In our opinion, the price will rise again after it hits the entry level.
Target and stop loss are shown on the chart.

Meta waiting for selling a stop order !according to my chart analysis Meta Facebook will go down if price reached entry level .

META Entry, Volume, Target, StopWhen price clears: 248.00
With daily volume greater than average
Target: 267.50 area
Depending on your risk tolerance: 241.50 gets you 3/1 Risk/Reward.
This trade idea is not trade advice. This swing trade idea is strictly based on my ideas and technical analysis. No due diligence or fundamental analysis was performed while evaluating this trade idea. Do not take this trade based on my idea, do not follow anyone blindly, do your own analysis and due diligence. I am not a professional trader.

META - KEYLEVELS 1htfMETA - KEYLEVELS 1htf
Meta is strong on his up trend , also beacuse we have a broken resitance on weekly time frame.
But now this zone looks more and more like a distribution zone , carefful on short META , if you wanna do it, maybe you need to wait for a broken red line ( neckline ) with a scalp trade.

Short Meta vs Long MicrosoftAfter the huge rally in recent months, earning season and recession fears could be bearish for tech companies.

#Meta H4 The Setup For A $300/310 TestIn this update we review the recent price action in Meta Platforms and identify the next high probability trading opportunities and price objectives to target

META - DISTRIBUTION ZONE?Meta on 15m tf it is on Distribution zone , now from here we have 2 options: Sell or buy.
I Will short Meta under the Support or i will long it if the resistance zone will be broken.

Meta is Continuing the Rally towards the Next Key LevelFollowing the recent breakout on the initial key level, a continuation of the bullish rally is expected, driving the price further upward. The anticipation is for the price to maintain its bullish momentum and move towards the next key zone formed.

META-SELL strategyMETA is overbought heavily, and for that reason it is providing an opportunity here.
Strategy SELL @ $ 272 and take profit @ 227 for now. I would add at higher levels when seen.


Continue to buy METAContinue to buy META as TikTok is likely to be banned from the Apple store! meaning new apple device will no longer have access to the app, nor will there be any updates.
In Addition, there are rumors, retailers have banned together to bypass Apple's tracking restriction by creating a customer influencer database tracking centered around META technology! this technology no longer relies on cookies but on AI on places you have visited and likely to visit.

META Update: Is There More to Give?Meta has been on a tear since its bottom of $88. This move has been what I am calling Primary Wave ((1)) of Cycle Wave III. I have a target box for the normal end point of this move up, however looking at the structure alone, it looks like this move up is about done. We are well past standard fib levels on the micro level with the power of this move, which is why I have to resort to structure and MACD alone.
Above is a 4HR chart showing a closer view of the sheer magnitude of this move up. It has risen 211% in a little over half a year!!! ..... and it may not even be done . Notice the arrows, these are important identifiers to be able to determine where we are in the count when you can't rely on fib levels. According to the information we are provided at this time, this move up looks done or at least on its last leg as with many other securities. If MACD makes a new high it changes this micro count, but DOES NOT CHANGE THE MAIN COUNT/TARGET BOX . A new high in the MACD just means we are still going higher in this wave ((1)).
On the big chart, according to the bigger picture we can technically go up to $376 and still be considered to be a "standard" move up. After ((1)) finishes, we will drop for wave ((2)) of III. This could take MONTHS to complete before ((3)) of III starts. Whenever it does though, that is 100% a trade I want to be a part of!!
Armed with this information do what you feel is best in your situation. When price tops or does something crazy, I will update. Hope this helps and until then, good luck everyone!
Bonam Fortunam,
--Tyler

Meta platforms Breaking an essential Fibonacci levelBreakout in Fibonacci level on daily charts with an upward trend asks for a bullish trade, with a precaution on retracement in short to mid term.
Disclaimer- For educational purposes, Please consult you financial advisor before an investment in financial markets.

METATagging the 0.618 retracement of the 2022 drop today. Reasonable place for this stock to take a break after a massive rally imo.

Cup & Handle//OverboughtTargets 1 through 3 have been met.
Big move and sometimes all we get is T1.
Cup depth is 148.77. Targets for C&H patterns are calculated using the depth of the cup projected from the EL level, which is slightly above the left side's high (sell side) then fib levels are applied. I use the .382, .618 and the .786. If price goes higher, I look for sell signals and use the 1.618 and the 1.272 as possible T2.
This is Overbought with RSI set of 80 versus 70.
No recommendation

META,10d+/-14.60%falling cycle -14.6% more than 10 days.
==================================================================================
This data is analyzed by robots. Analyze historical trends based on The Adam Theory of Markets (20 moving averages/60 moving averages/120 moving averages/240 moving averages) and estimate the trend in the next 10 days. The white line is the robot's expected price, and the upper and lower horizontal line stop loss and stop profit prices have no financial basis. The results are for reference only.

META Monthly SetupMETA have break strongest support on Mn Chart. Buy trend is a pullback. There you go my sell area

META:Go for a surf with the wind and wavesMeta's stock has been performing remarkably well in 2023, largely owing to an improved sentiment towards tech stocks, the company's aggressive cost-cutting measures, and its focus on Generative AI.
In the first quarter of 2023, Meta's revenue surprisingly increased to $28.64 billion, a 3% increase year-over-year, with a net income of $5.71 billion, a decrease of 24% compared to the same period last year. This growth in revenue could be partially attributed to the recent launch of a new advertising software suite called AI Sandbox. Utilizing Generative AI, this tool assists advertisers, which had a positive impact on the market and led to a 2% increase in Meta's stock price on the day of the announcement. The AI Sandbox currently includes three features: text variation, background generation, and image cropping. These functionalities aid advertisers in creating more personalized, relevant, and engaging advertisements. Meta plans to publicly launch AI Sandbox in July 2023, adding more features such as video generation and audio synthesis.
However, it's important to note that the company's Reality Labs division, responsible for developing virtual and augmented reality technologies for the metaverse, reported sales of $339 million but an operating loss of $3.99 billion. The company anticipates that this operational loss will increase further this year. Although the short-term operational loss from the Reality Labs division may impact Meta's stock price, in the long run, with the proliferation of the metaverse, Reality Labs is expected to provide substantial returns for the company and its shareholders.
From a technical perspective, the broader cycle appears temporarily overbought. There's a resistance channel at 260, and a minor correction is expected, with a support level at 230. The alligator indicator continues to diverge upwards, and with three consecutive bullish weeks, there's a significant chance of breaking directly above the 300 round number. Therefore, I am upgrading my rating for META from "hold" to "buy", and raising my price target from $220 to $320.

$META - Trend Value Trigger=============================TRADE LAYOUT============================
1. IDENTIFY THE TREND
a) Series of new higher high swing and higher low swing: YES
b) 10 EMA > 30 EMA > 50 EMA: YES
c) EMAs pointing upwards: YES
d) Output: UPTRENDING MARKET
e) Bias: LOOKING FOR LONG OPPORTUNITIES CLOSE TO VALUE AREAS
2. IDENTIFY THE VALUE AREA
a) 10 EMA: OFFERING SUPPORT SINCE JAN, 2023 - $228
b) 50 EMA: -
c) Support area: - $225-$235
d) Demand area: -
e) Trendline: -
3. LOOK FOR A TRIGGER IN THAT AREA
a) Candlestick pattern: BULLISH MARUBOZU
b) Break of structure in the lower timeframe: -
4. SET A STOP LOSS
a) 1 average bar size (14 periods) below the value are: $218 (10 EMA - AVERAGE BAR SIZE LAST 14 PERIODS)
b) 1 ATR below the value area: -
5. SET A TARGET
a) Resistance area:
b) Supply area: $319 - $329
c) 10 EMA: -
d) 50 EMA: -
e) Trendline: -
6. POSITION SIZE / RISK MANAGEMENT:
a) No more that 1% of your total equity at risk on an single trade, therefore: (Stop Loss (set logically as per above) / Entry Point) x 100 / Total Equity < 1
b) No more than 30% of your total equity at risk at any given moment
=============================WHY?===================================
WHY TRADING WITH THE TREND?
The trend is your friend. Trends do bend, but until that unavoidable moment comes, the odds get tacked on your side if you trade in the same direction of the trend.
WHAT IS A VALUE AREA?
Just an area where the odds are, the bulls will step up and support the price, or the bears will step up and stem a sell off.
WHAT MAKES YOU THINK YOU CAN IDENTIFY THEM?
Rational behavior from big institutions, herd behavior, quantitative anchors, qualitative anchors from other traders. These are usually translated into price movements, price movements that leave traces, even patterns.
Let me give you a couple of examples for argument's sake:
a) You want to fly to Japan, so you jump into your flight tickets' website to purchase your tickets. Today you see that the price of a ticket is 500$. You think it is too expensive, so you decide to wait for tomorrow to check if the price decreases. Tomorrow you check again, and now the price is 600$. What do you do next? Perhaps you wait another day, and then you see the price getting back to 500$, those 500$ now look cheap to you so you buy (support). Or perhaps then it becomes 700$ and the FOMO kicks in and you buy because tomorrow it might as well be 800$.
b) Investment Fund Warren Buffet and Co has done their due diligence, applied their fundamental assessments and decided stock X is cheap at 10$ and purchased stock X, which happened to be trading at 10$. Like a ton of stock, billions worth of it. A month later, after stock x rallied, it got back to trading at 10$. Unless the macro situation has dramatically changed, what do you think Hedge Fund Warren Buffet and Co will do now?
c) Richcoin is trading at all time highs. Everyone in your neighborhood holds richcoin. The cab drivers are thinking of quitting their jobs because they hold richcoin. Are you really going to be the only loser who does not buy richcoin? - Herding.
d) Investment Fund Jesse Livermore and Co has stacked loads of shares of stock Y. It has already started to conduct a marketing campaign. Since it is necessary for the public to buy and price up their stock, they can risk having an early sell off in their stock hampering their campaign. So they can't risk having the public panicking with sharp price declines … yet. So what happens when the price touches key EMAs like the 10 and the 50 (w), they support the price and the uptrend.
Behaviors like these echo through the markets. And they leave traces.
WHY DO YOU NEED TO IDENTIFY THESE AREAS?
Because you want one of two things:
1. Your idea is supported by the team you chose to support.
2. Your idea is not supported but in any case you get the chance to know that immediately and not waste further time and money with your idea
HOW ABOUT THE TRIGGER? WHY DO YOU NEED IT?
Ok, the price is trading in a value area. But can you really tell in which direction it is moving now? Well, you never, but if you identify a directional pattern springing in that area, then once again you stack the odd on your side if you just follow that direction, even though shakeout will sooner or later knock on every trader's door.
AND POSITION SIZING?
This should even have been rule number zero. Nobody, and I mean, nobody knows the future. No technical analysis or fundamental or whatsoever, will ever save you from the uncertainty of the future and the complexity of reality. That means that this is a game of stacking odds in your favor, not aiming at certainties. That means that this is a game of guaranteeing your survival in the markets each day, to make sure you have an everlasting exposure to favorable odds and positive black swans.
====================================================================
Having this said, discretionary trading is a heavy burden, so many choices, so many doubts … At a certain stage of your development as a trader you will realize that setting a quantified trading system, which translates these biases and ideas into numbers, conditions, signals and commands, and is time tested, is your next step as a trader.
If that's the stage where you're at, then feel free to drop by my store for backtested, quantified trading strategies across all markets and asset classes.
Cheers,
Tenacious Tribe - Back Tested, Quantified Trading Strategies & Studies
50% discount on all products! Use code MOX Q3C WXRX on our website to unlock this limited offer.

120s by next earningsWhen META was still in the low 100s I predicted 220-230 by mid 2023.
Now I’m predicting 120s by earnings next that’s all you need to know.
