3M – time to buy?It is high time we look at 3M chart again. Last time I analysed it in November 2014. The gauge was caught in the middle between the support level of a rising trend of October 2011 and the 261.8% Fibonacci resistance level against a fall from October 2007 to April 2009. On the monthly chart, the situation is virtually unchanged, the risk/reward ratio is equal both in terms of buying and selling. As for smaller time frames, security holders must be feeling quite comfortable. On daily and weekly charts, there are signals that the reading is rather likely to reach the USD 188 resistance level than the USD 150 support level. I would like to underscore once again that this is a positive moment for security holders. If someone was not in time to buy them, it is illogical to count on growth given what the technical analysis shows in terms of the risk/reward ratio.
s30707642478.whotrades.com
MMM trade ideas

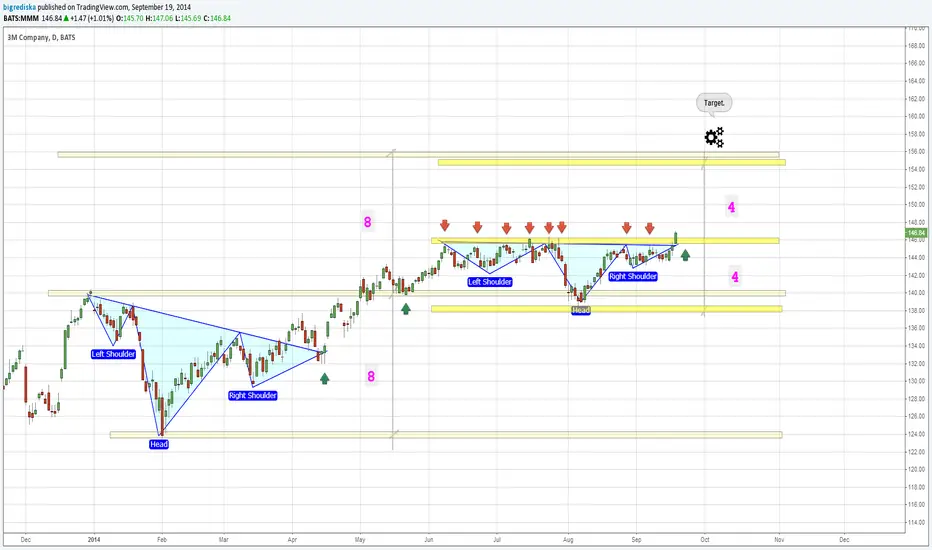
MMM Excess Supply & Cyclical Resistance. $144 zone.Supply taking down MMM since 2014.12.18. Support at $159 - 158 likely to provide bounce into lo demand right shoulder. next support is in $144 area.

3M CompanyThis may sound somewhat unbelievable, but many of the things that make our daily life easier were invented at this company – 3M. For this reason, at Warren Buffett’s behest, every self-respecting trader should watch for and purchase 3M equities, whose goods and services we all use.
But what is the motivation for buying into 3M? Multiyear upside in these shares looks simply too good to be true. The name appears to be visibly overpriced.
Sad but true. However, in addition to the high cost, there are also high aims. There is currently only one obstacle – the USD 188 mark (the 261.8% Fibonacci retracement level of the 2008-2009 downturn). That makes the gambit really quite simple: before buying into 3M let’s wait until it reaches the support level of a rising trend as of end 2011, around USD 132-135.

MMM strength to the upsideMMM has periods where it trends really well. But this year there have been two deep pullbacks which would've stopped most trend traders out of their buy positions.
Since price broke above the September pivot high the candles have not been overly convincing. There was a gap up on 31st October but it was a doji, followed by a gravestone doji, which did not inspire confidence. However, the next bar broke out on higher volume so this could've been the first opportunity to get into this trade.
Yesterday another bullish flag was confirmed (on higher volume) offering traders the opportunity to now consider entering long on MMM (or add to their trade).

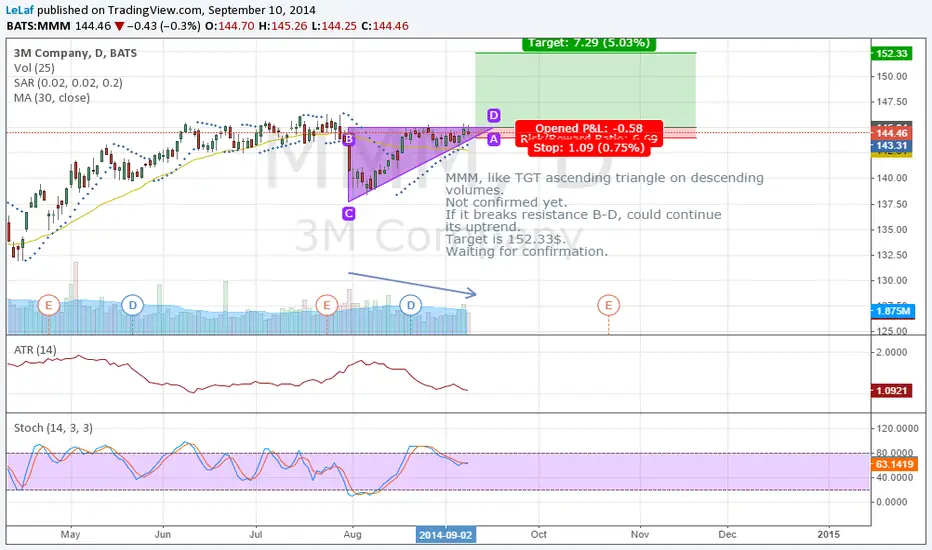
MMM ascending triangleMMM, like TGT ascending triangle on descending volumes.
Not confirmed yet.
If it breaks resistance B-D, could continue
its uptrend.
Target is 152.33$.
Waiting for confirmation.
3M Beginning to Lose SteamDistribution appears to be taking place in the daily time frame as a triple top as formed, and about to test support gained for the third time. Monthly, and weekly charts are also beginning to show possible signs of momo death. These are the swing target areas I'm interested in once 143 fails.

Long Position Break out 140,43Position Break out wave 3
Daily chart above 2 days 140,43 next target wave 3 144,49 end correction 138,80 wave 4 the next target 150,82 the wave 5 end close posisitio
Thanks end good luck


MMM - Up we go againThere is nothing much I can say but I will try to say a few things.
First of all, 3M company is one of the strongest companies in the DOW Industrial average, you can see that by plotting the Dow on the chart.
Swing trading works very nice on this stock, breakout trading too.
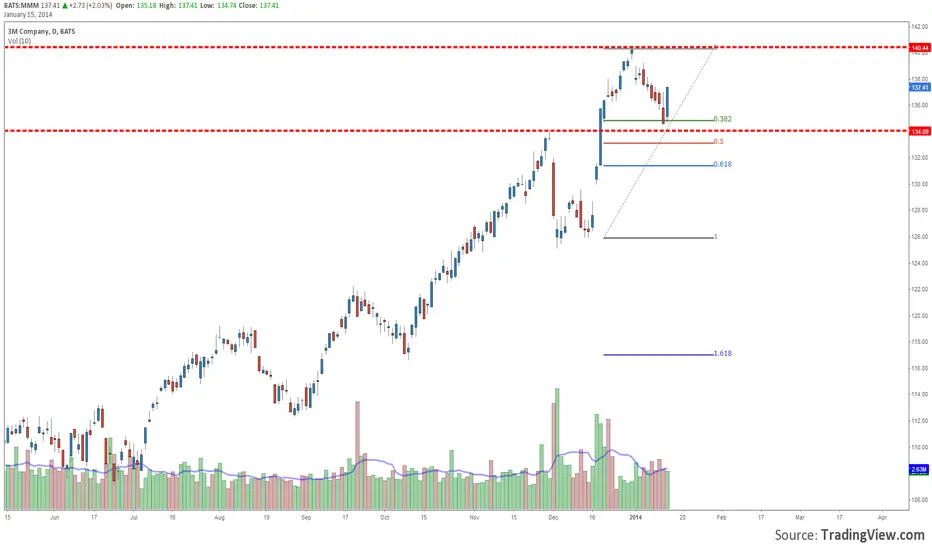
We had a retest of the previous resistance, now support. At this level we had an inverse hammer followed by a long day, volume not so good. Also, the pullback stopped at 38.2% fib.
Earnings are in 2 weeks so that shouldn't be a problem. Long on market open if there is no ugly gap down.
MMM Quick Money Making Trade Setup 3M Co (NYSE:MMM) has been crushed over the last couple days. While many are too scared to step up for a swing trade, I am watching the daily 50 moving average and the $124.70 level. Should this point be hit today or tomorrow (only), a long swing trade is likely to pay profits. Look for a $2.00-$3.00 bounce should the $124.70 level be tagged.
Gareth Soloway
Chief Market Strategist
www.InTheMoneyStocks.com


MMM correction.MMM is in a very well defined uptrend and is currently overbought according to support and resistance and stochastics. Am waiting for a dominant bearish candle and/or the stochastics to cross below the 80 line.
Options: sell short, call credit spread, put debit spread, buying a put.

$MMM: Bear Flag SetupPay close attention as the .886 must continue to hold as resistance. If this level fails to hold resistance, get long.
Short term short targets are the .618 and .50 fib levels posted.

