NFLX Price Soars 12% after Strong ReportYesterday's closing price was 345.83, but this morning, NFLX's price rose above USD 390 per share in premarket trading. The reason is a strong report:
→ earnings per share = USD 3.73, expected = USD 3.49;
→ revenue = USD 8.54 billion, a year ago = USD 7.9 billion.
→ the main surprise is that the number of subscribers grew by an impressive 8.76 million in the third quarter (about 6 million were expected). The number of subscribers worldwide is approaching 250 million.
Given the increase in demand for its service, Netflix has decided to raise the price of its basic plan in the US to USD 11.99 per month from USD 9.99, and raise the price of its premium subscription to USD 22.99 per month from USD 19.99. This could attract more earnings per share in the future, which is what has helped NFLX's price soar.
From the technical analysis point of view:
→ NFLX price returns to the ascending channel that was in effect in 2023 and seems to be becoming relevant again. The false breakout pattern could become a support zone in the future.
→ NFLX price exceeded USD 370 per share.
Since early September, NFLX has been a laggard in the NASDAQ index, but after the report it may become one of the leaders. "While we have much work to do to build out this business, we're making good progress and laying the foundation for what we believe should be a multibillion-dollar revenue stream over time," Netflix executives wrote in a letter to shareholders.
Resistance to a powerful bullish impulse may come from:
→ psychological level of USD 400;
→ level at USD 412 – during the summer, the level provided support. But it was broken on September 13-14, and with a bearish gap, which could slow down the rally if the price of NFLX reaches this level. Also note that here is the Fibo resistance level of 50% of the decline A→B.
According to TipRanks, analysts have a target price of USD 454 for NFLX, but given its recent performance, the forecast could be raised.
This article represents the opinion of the Companies operating under the FXOpen brand only. It is not to be construed as an offer, solicitation, or recommendation with respect to products and services provided by the Companies operating under the FXOpen brand, nor is it to be considered financial advice.
NFLX trade ideas

Netflix to 175?Netflix (NFLX)
1. Price Formation: The price has broken out from a Rising channel (Flag) price formation on a daily chart.
2. Moving Averages: The 7-day moving average (MA) is below the 21-day MA, which is a sign indicating short-term bearish momentum.
3. 200-day Moving Average is above the Price.
4. Thus, Mas 7<21 and 21=200
5. Relative Strength Index (RSI): The RSI is <than 50, indicating bullish momentum and potential further upward movement.
6. Price Target: to the bottom of the channel at 175

NFLXNetflix (NASDAQ:NFLX) shares surged over 10% in after-hours trading after surpassing profit expectations and seeing a rise in subscribers. In Q3, they reported an EPS of $3.73 and revenue of $8.54 billion, exceeding analyst predictions. Paid subscribers grew by 8.76 million, well above expectations. While industry challenges persisted due to strikes, Netflix is committed to resolving issues and anticipates a Q4 EPS of $2.15 and revenue of about $8.69 billion, with a 2023 operating margin near the top of its range at 20%.
Risk Disclosure: Trading Foreign Exchange (Forex) and Contracts of Difference (CFD's) carries a high level of risk. By registering and signing up, any client affirms their understanding of their own personal accountability for all transactions performed within their account and recognizes the risks associated with trading on such markets and on such sites. Furthermore, one understands that the company carries zero influence over transactions, markets, and trading signals, therefore, cannot be held liable nor guarantee any profits or losses.

NFLX Falling into a Dark Pool Buy Zone?While we all wait on the highly anticipated NASDAQ:NFLX earnings report at the close today, let's study the weekly chart to study the downside potential since the stock gapped down today on expectations of a weak report.
Netflix’s percentage of shares held by institutions has recovered to a respectable 79%, which is more consistent with a company that is in favor with the Buy Side Institutions. There has been accumulation going on since the lows of 2022.
Selling Short is problematic due to the support levels not far down from the current price and the risk of a hidden Dark Pool Buy Zone starting at the highs of the U-shaped bottom formation.
The current run down is at a technical support level, which is where pro traders often nudge the price to trigger HFTs. Beware of the risk of an extreme reaction at the open tomorrow. During earnings season with a report at the close, pro traders often take profits either in the final minutes of the day to avoid the risk of a surprise, or shortly after the open to capitalize on the reaction to the report.

NETFLIXNETFLIX falsely broke the growing channel it had been building since the bounce.
Subsequently, it lured many impatient bears into short positions, and the subsequent strong rally from $300 is thus parasitizing to liquidate their short positions.
I expect a real rejection from the $500 area.
Invalidation is on a strong break above $500 and testing as support.

Netflix it's ShowTimE !!Hi mates, sharing Daily chart of Netflix for a possible detailed analyis according to my observations, So as we can see on weekly chart that after making a all a time high of 700 levels in the November 2021 it made a low of 163 levels the May 2022 it was a cut of 76% from all time high levels at that time and after price created a base near to 170-190 levels and started it's journey in uptrend again.
So according to data above shared it halted it's reversal journey near to 372 levels where price took a strong resistance (marked on chart) and came down a bit near to 290 levels, And after when it broken that that 372 levels it gives a parabolic move in ascending channel marked on chart too and that breakout took price to 485 levels in the July 2023. And after break of that ascending channel support line price tried to go again in that channel but failed and in this process it made a double top on provided chart and after the break of neckline mentioned on chart it reached to near that 372 levels again now.
So my point is this that price currently it is trading near to 372 levels which can act as a support now prior it was resistance as mentioned in description above. If break and close below can check lower support target below, and if bounce we can see it can test mentioned neckline area again or above after the break of neckline which surely will act as resisatnce for now.
Will try to give proper updates if i will go for any executions in it.
Price can take 200 Ema support also
This is not and trade or investment advice. This idea is meant for learning only.
Best Regards happy trading- Amit

$NFLX: Further down into earnings?Comms, as previously stated in past posts, are of concern and unless the unemployment report tomorrow sends market's skyrocketing. I think we will struggle a little bit more, at least as we head into the earnings report along with broader financial names already covered here.

Nflx puts for earnings today. Strangle. Will be buying a few otm puts and one very far otm call strangling Netflix. Earnings likely to see a big down move.

Netflix user growth to prove recent correction is a spikeNetflix's third-quarter 2023 results will be announced on Wednesday after the stock market closes
The company has implemented a policy prohibiting the sharing of accounts outside the household
Will that reflect in the earnings, making the stock correction a buying opportunity?
The global entertainment landscape has undergone a transformative shift with the rise of streaming platforms, effectively eclipsing traditional media such as television.
Leading this digital revolution is Netflix (NASDAQ:NFLX), providing audiences access to an extensive library of movies and series for a modest subscription fee.
As we approach Wednesday, expectations are running high for the release of Netflix's third-quarter results, a key event in light of the platform's recent policy shift regarding password sharing.
Introduced in May of this year, this change aimed to curb the unauthorized sharing of accounts and appears to be having the desired effect, as user numbers continue to grow – a change that is poised to manifest itself in the forthcoming third-quarter figures.
Yet, intriguingly, despite Netflix's robust user growth, its stock has been navigating a broad correction phase, prompting speculation that the conclusion of this adjustment may yield results exceeding current forecasts.
In the lead-up to the results, all eyes are on Netflix's projected earnings per share, which currently stand at an estimated $3.48, alongside revenues totaling $8.53 billion.
Notably, the forecast has experienced a remarkable 24 upward revisions, with only 3 instances of downward revision, indicating a high level of market anticipation.

NFLX earning coming#NFLX creating reversal divergence but still weak when it still closed below 364$
IF NFLX can break above 364$ will back test 371$. Above 371$ will be 377$
IF NFLX hold below 364$, support will be 354$. Break down below 354$ can be 346/340/332$

💵 E a r n i n g s J o u r n a l 📶 S T A T I S T I C A L A N A L Y S I S
Current 50-Day Market Trend: short/sellers/negative.
Next Swing: negative swing to resistance.
Next Wave: buy wave to the deviation.
Next 50-Day Market Trend: long/buyers/positive.
Trade Type: Touch & Go don't wait for a close.
💵 E A R N I N G S A T A G L A N C E
Release Date: 10/18 AMC
_______________________________________________
Revenue Anticipations: negative surprise for Revenues.
Revenue Surprise-Confidence: on a scale of 0-9, #2
Revenue 2-Year Trend: the company trend in Revenues is positive.
_______________________________________________
EPS Anticipations: positive surprise for EPS.
EPS Surprise-Confidence: on a scale of 0-9, #6
EPS 2-Year Trend: the company trend in EPS is neutral.
_______________________________________________
📝 S Y N O P S I S
"I expect the market will buy the +surprise if the earnings report hits the Wall Street consensus, or sell the -surprise if the earnings report misses the Wall Street consensus."
🔎 R E S E A R C H D E P T H
Technical Analysis: daily chart.
Fundamental Analysis: EPS & Revenue data.
Press/News: none.
Social Media: none.

NFLXJust a technical look..
Technical view means only analyzed chart and nothing else..
This analysis can be easily completed and the time frame is high, so it will take a lot of time.

Good long opportunity in NetflixWith the recent recovery from NASDAQ:NDX from in the last 2-3 days, i would like to go long if NASDAQ:NDX breaks out from its trendline.
NASDAQ:NFLX is an attractive option as i believe we can get a 1:2.5 approx long trade here with a possible 16% upside. Since last year we have seen a higher high higher low trend which is again trsting its new higher low as it is being supported by the volumes near the 50-100-200 DMA near this price level. I would like to go long if NASDAQ:NDX breaks out on NASDAQ:NFLX with a SL below the DMAs.
All eyes of NASDAQ:NDX and NASDAQ:NFLX for a good RR swing trade.

$NFLX - Can it bounce from trendline?NASDAQ:NFLX Netflix has paid the head and shoulders breakdown and reached the $368 target as mentioned in my previous post on Aug 15.
Currently, it's trading within a downtrend channel. There is a potential for a bounce from the lower trendline.
However, there is still a risk that it can see further downside to $354. So know your risk.
Targets to the upside:
$387.37
$411
Downside risk:
Could Netflix (NITFLIX) keep Falling ?Hello Everyone,
Today, I've spotted a very compelling signal to short on Netflix (NFLX). I previously mentioned that this stock was likely to decline, and now it appears that it could continue falling for three reasons:
1) The market Broke the Trendline with significant Volume.
2) Right after the break, the market retraced to the trendline, which we call a 'PULLBACK,' and then continued its downward movement with significant momentum.
3) What encourages me the most to set a target of $316 is the Fibonacci extension levels. These levels are reasonable, as you can see on the chart, and the 1.618 level is an optimal target to consider for taking profits.
I hope you've enjoyed reading my analysis of Netflix stock. If you find my insights beneficial, please hit the like and follow buttons for more ideas.

NFLX earnings watchNFLX earnings are on Wednesday 7/19/23 at 4pm. Netflix (NFLX) reported Q1 March 2023 earnings of 2.88 per share on revenue of 8.2 billion. The consensus earnings estimate was 2.83 per share on revenue of 8.2 billion. Revenue grew 3.7% on a year-over-year basis. The company said in its shareholders letter it expects second quarter earnings of approximately 2.84 per share for the quarter ending June 30, 2023.
NFLX Q2 June 2023 Consensus:
EPS = 2.82
Revenue = 8.27 B
PE = 47.5
NFLX earnings recap since 2022:
1/20/22 = (- 110)
4/19/22 = (-82)
7/19/22 = +14
10/18/22 = +11
1/19/23 = +13
4/18/23 = +1
NFLX VWMA levels:
VWMA20 = 435
VWMA50 = 399
VWMA100 = 359
VWMA200 = 318
NFLX options data:
7/21 expiry
Put Volume Total 30,928
Call Volume Total 45,847
Put/Call Volume Ratio 0.67
Put Open Interest Total 124,823
Call Open Interest Total 121,902
Put/Call Open Interest Ratio 1.02
8/18 expiry
Put Volume Total 5,613
Call Volume Total 7,508
Put/Call Volume Ratio 0.75
Put Open Interest Total 25,430
Call Open Interest Total 32,265
Put/Call Open Interest Ratio 0.79
9/15 expiry
Put Volume Total 2,769
Call Volume Total 2,525
Put/Call Volume Ratio 1.10
Put Open Interest Total 47,611
Call Open Interest Total 44,274
Put/Call Open Interest Ratio 1.08

#NFLX is it time to buy NETFLIX and CHILL?Netflix at a very interesting level here. 38.2 fib retracement of June lows and July highs. Channel Support. Previous resistance now support? Reversal off 200dma. Seems like a plausible level to attempt a long

NETFLIX: Buy opportunity on a 4 month stretch.NFLX is trying to find support on the 1D MA200, which is at the bottom of a (longer than a year) Bullish Megaphone pattern. The 1D technical outlook is red (RSI = 36.027, MACD = -9.900, ADX = 36.923) signifying considerable upside potential and the rebound on the 30.00 oversold RSI level indicates the reversing momentum. We expect an immediate rally as part of the new bullish leg that will target the 0.786 Fibonacci (TP = 585.00).
Prior idea:
## If you like our free content follow our profile to get more daily ideas. ##
## Comments and likes are greatly appreciated. ##

Bullish on Netflix.
As you can see here, we have bounced off of a major trend line and the YTD VWAP as well. The MACD is about to cross and the RSI hiekin ashi has flipped from oversold to green. This is all on the daily chart.

NFLX: BIG UPSIDENFLX has bounced off it's upward trendline with weekly RSI showing oversold. PT1 is $347 and PT2 is $449.

Netflix - Come in...the water is fineWe dived below the Center-Line.
This is the time for a short, not when it's down at the Lower Medianline Parallel. Because there are lurking Creatures you don't want to meet.
My stop would be above the CL test high.
Keep in mind that earnings are coming out soon. So mybe give yourself time and trade it with an Options Strategy?
Gone for a swim...the water is fine §8-)

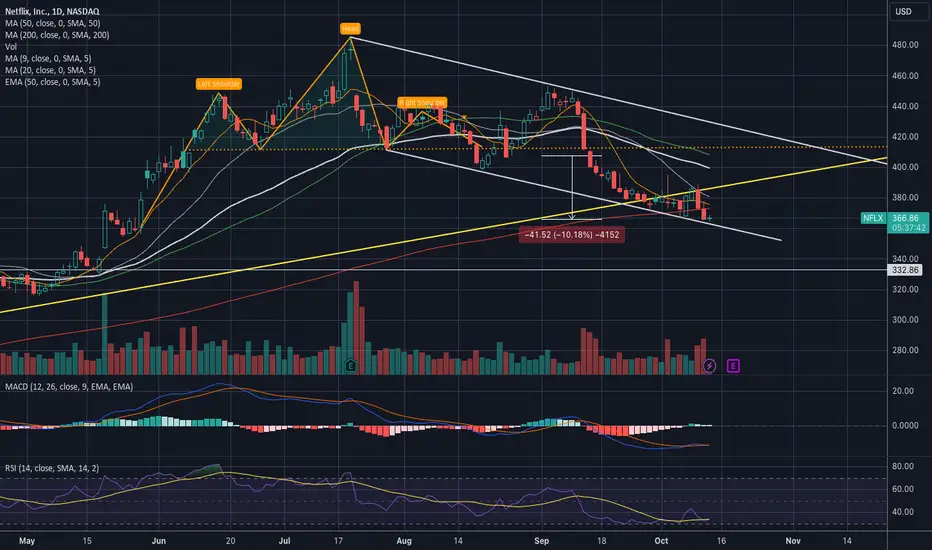
NFLX Analysis: Changes in Management, Price at MinimumYesterday, the NFLX share price dropped below USD 370, the lowest since late May of this year, and about -22% from the July peak.
Note that on July 6, we wrote that the NFLX stock price could meet resistance at USD 450 per share, and the signals from the chart gave bearish warnings. Just since July, the stock price began to perform worse than the broad S&P 500 market index.
Perhaps the company knows better about the reasons for the emerging negative dynamics and is making changes in management. This week it became known about the appointment of Amy Reinhard to the post of president of the company's advertising business. New product directors and technical directors were also appointed.
Will new executives help the stock return to its upward trajectory?
Bearish arguments:
→ a long upper shadow on the October 3 candle may indicate the strength of sellers in the stock market;
→ Thursday’s bearish candle may become an element of a breakout of the long-term channel (shown in blue);
→ pressure on the price of NFLX shares may be exerted by a negative trend in the stock market due to the tough policy of the Federal Reserve.
Bullish arguments:
→ a breakdown of the lower border of the ascending channel may turn out to be false;
→ support may come from the level of USD 370, which previously had an impact on the price.
The approaching earnings season may have a strong impact on the price. Already on October 18, we will learn the results of NFLX for the past quarter.
This article represents the opinion of the Companies operating under the FXOpen brand only. It is not to be construed as an offer, solicitation, or recommendation with respect to products and services provided by the Companies operating under the FXOpen brand, nor is it to be considered financial advice.

Netflix's Bullish Trend Ending: Traders, Prepare for Downtrend!Hi Realistic Traders. Here's my price action analysis on Netflix
In our close examination of NFLX, the streaming titan, a compelling narrative unfolds. Initially, a double-top pattern emerged between July 2020 and January 2022, followed by a significant breakout from the neckline. This breakout confirmed a bearish reversal, resulting in a remarkable 70% decline from its peak.
However, the plot deepens. NFLX recently revisited its double-top pattern's neckline while concurrently crafting a channel chart pattern. Adding to the intrigue, NFLX struggled to regain its former heights and descended below both the lower trendline and the dynamic support line, a classic sign of a sustained bearish trajectory.
Not to be overlooked, the Stochastic indicator chimed in with a bearish divergence, providing further validation for the impending downward movement.
Our target price? Set conservatively at under $300.
Traders, prepare for a captivating journey ahead!
It is essential to note that the analysis will no longer hold validity once the target/resistance area is reached.
Please support the channel by engaging with the content, using the rocket button, and sharing your opinions in the comments below!
Disclaimer:
"Please note that this analysis is solely for educational purposes and should not be considered a recommendation to take a long or short position on NASDAQ:NFLX ."
