NFLX going down through mid-OctoberNFLX has a significant amount of options GEX showing 380 in October, I expect the stock to continue it's downturn, perhaps with some fluctuation through October.
NFLX trade ideas

NETFLIX Is the streaming Giant a buy again?Netflix (NFLX) had a great run since our March 23 long (see chart below) and gave us more than +51% return in 4 months:
The long-term pattern remains a Bullish Megaphone and right now the price sits on its bottom (Higher Lows trend-line) as well as the 1D MA200 (orange trend-line), which has been unbroken since November 10 2022. On top of that, the 1D RSI is oversold on the 30.00 Support. Last time it was this low (March 10), the Megaphone priced a Higher Low bottom. As you realize, along with the 0.382 Fibonacci, we currently sit on a quadruple level Support Cluster.
Based on the 93 candle (roughly 135 days) rule within this Megaphone, which suggests that at the end of the 93 candle count, NFLX will either be near a High or a Low, we still have around 2 months to call a bottom. As a result, if the 1D MA200 and Megaphone break, we can see a slow descend along the 1W MA100 (red trend-line) and then pick up a reversal.
Either way, the once mighty streaming giant is entering a new long-term Buy Zone. Our target is the 0.786 Fibonacci extension ($587.50) even though we wil most likely see the Megaphone peak higher by Q2 2024.
-------------------------------------------------------------------------------
** Please LIKE 👍, FOLLOW ✅, SHARE 🙌 and COMMENT ✍ if you enjoy this idea! Also share your ideas and charts in the comments section below! **
-------------------------------------------------------------------------------
💸💸💸💸💸💸
👇 👇 👇 👇 👇 👇

Long NetflixI'm long netflix here on the 4hr macdh diveregnce as shown at support. Target red line as shown. Very oversold on daily.
Have been buying up all tech for last two days

(NFLX) – Bullish Signal: Bullish Signal: Break and Retest at 200Analysis:
Break and Retest Pattern: The chart clearly shows that NFLX recently broke above a significant resistance level, indicating a potential shift in the trend. This break is marked as a bullish signal.
200-Day SMA Support: As NFLX retraced after the breakout, it approached the 200-Day SMA, a widely watched long-term trend indicator. The 200-Day SMA has historically acted as a strong support level. This retest of the 200-day SMA serves as a critical point of interest.
Bullish Scenario: If NFLX successfully holds above the 200-day SMA support level following the retest, it could signify a continuation of the bullish trend. This could attract more buyers, potentially driving the stock price higher.

Netflix's bleak futureUnlike Microsoft, Apple, and Nvidia, it failed to break through its ATH, and a pullback is inevitable. Aside from a few exclusives, Netflix is losing its differentiation from other platforms. The gap is closing and other undervalued platforms will quickly eat into Netflix's market capitalization.

NFLX - Bearish SequenceNetflix has been in a Downtrend since July 19th.
After its failed attempt at a Higher High, price decided to break down below its Low (Point A) beginning my Bearish Sequence Setup and I believe it is on the move to Retrace to the Fib'd Range @ 412.27 - 398.52 to be rejected down to Sequence Target @ 315.6 - 283.05!
As for indicators, Price Action has moved beneath a curling 200 EMA and my Dynamic Support & Resistance strengthening my Bearish Bias.

Dive into the Coolest Blue Vibe: Unveiling TradingView Skin! 🎉✨Hey there! 🌟
Guess what? I've just whipped up my very first skin for TradingView, and it's got this super chill blue vibe! 🌊 Not only is it a treat for the eyes, but it's also packed with snazzy animations and color pops. 🎨✨ I'm super curious - what do y'all think? Got any cool suggestions or tweaks in mind?
Fancy using this theme? Drop your email in the comments and I'll buzz you soon! 💌 And don't sweat, setting it up is a breeze on any browser. 🌬️
Catch ya soon! 😄🚀

NFLX, Severe Factors to Confirm Huge BEARISH-Wave Breakout Next!Hello There!
Welcome to my new analysis of NFLX. The NFLX price action already determined a heavily bearishly inclined bear-market wave towards the downside printing a bearish wave of over -70% and liquidating a ton load of bull-trapped positions with the crucial bearish wave A. Now, NFLX is in this meager uptrend which is not anything than a next continuation pattern as the volume is decreasing and the institutional smart money operator's short-side positions increased heavily.
Now, NFLX is already approaching the crucial upper distribution resistance channel within the gigantic bearish descending channel formation from where the next bearish wave towards the downside is likely to emerge next. In this case, the next bearish wave acceleration phase is going to happen when NFLX breaks out below the 100-EMA which will be the last frontier to the massive bearish determinations to follow once this breakout happened.
With the huge ascending wedge formation that NFLX formed before the bear market decline, NFLX already set the origin of this bearishly inclined structure. This means that with the current weak uptrend that has no volume, no momentum, and no smart money backing the final bearish bear flag breakout is more than overwhelmingly likely. Once this breakout has been activated it is going to be the origin of the bearish expansion wave C towards the lower levels.
Taking all these factors into consideration NFLX is definitely a bearish inclined stock currently and the major disruptional bearish momentum continuations are likely to emerge anytime soon. In this case, it is necessary to approach the short-side opportunity appropriately, a potential entry setup has already formed as the volume declines more and more and NFLX already finalized the bear flag formation. Because of the significance of this whole bearishly inclined determination, I am keeping NFLX on the short candidate's watchlist.
Thank you everybody for watching my idea about NFLX. Support from your side is greatly appreciated.
"In a bear market, you have to use sharp countertrend rallies to sell."
VP


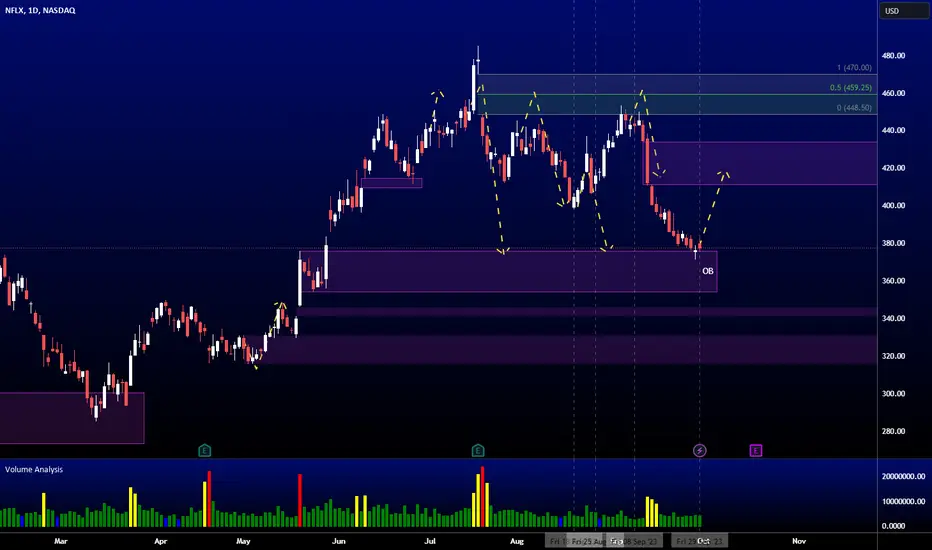
NFLX AnalysisPrice playing nicely to my last analysis. Price missed the 50% FVG at 459.25 be a little and proceeded to dump. My expectation was for price to hit the bullish OB at 375.87. This has happened last week, giving us a -16.19% move to the downside since my last analysis. From here, I'd wait for a confirmation for price to move back up to the premium level, potentially to fill the imbalance created at 411.39.
$NFLX short term bounce ideaNASDAQ:NFLX just tested the daily breaker block and giving a change of character in 15 minutes. there is an order block with liquidity. if the liquidity is taken a bounce to test the previous SL hunted zone is possible. I am not trading. This is just a passion in identifying trades.
This is only for educational purposes.

Netflix in coming weeks! - sidewaysNetflix is on 50-% of last big move and its time for its sideways movement.

#NFLX Looking For Bids Into 368 To Target A 400 TestIn this update we review teh recent price action in Netflix and identify the next high probability trading opportunity and price objectives to target
PAST PERFORMANCE NOT INDICATIVE OF FUTURE RESULTS

NetFlix - Come in, the Water is fine!Below the Lower-Medianline-Parallel, the Water is fine!
,..you think?
Maybe, but there's a Shark waiting for you.
He's Name is "FOMO"!
If you waited for a retest of the L-MLH, then you wasted your time. Here is how you trade a open/close below the L-MLH:
- short immediately with a money Stop/Loss
or
- wait for a re-test of the L-MLH, and short from there on obvious weakness. Put your Stop behind the re-test high.
But don't jump in the mouth of the "FOMO" Shark!
I added the Members material on my website.
Check it out, it's free for all, but you must be a brave Trader §8-)

NFLX | SHORTNASDAQ:NFLX
Possible Scenario: SHORT
Evidence: Price action
* if it breaks 409$ and holds it, it will surely hit lower levels, like 370$ and 300$ before EOY.
I'm very confident about this idea.
Timeframe: two weeks.

#NFLX create bullish harami cross#NFLX create Bullish harami cross on Daily chart.
IF #NFLX can go above 387$, next target will be 395$.
IF #NFLX go below 379$ will be failure Bullish harami, next support :373$/368$

HEAD & SHOULERSPrice is hanging on the neckline. This pattern is not valid until the neckline is broken with a downtrend,
RSI Divergence noted.
Price fell from a Rising wedge which is bearish but has possibly recovered.
Earnings 10-18.
Short is around 2%.
No recommendation

Netflix technical viewNASDAQ:NFLX should be coming back to reality.
Their shows and movies are either terrible, over budgeted, and only a small minority are good, while, competitors such as HBO and Apple are making much more efficient content at a higher path.
Technical aspect looks terrible, sold my shares bought at $192

Inverse head and shoulders set upreviewing NASDAQ:NFLX monthly chart, and looking through multiple time frames. I discovered a sneaky Inverse head and shoulders on NFLX.. Stoch RSI on the monthly chart is showing a double top, however on the 1000r you'll notice oversold stoch rsi.. previous resistances from a bearish crab (b) leg is acting as support..
I may do a video analysis on how I came to this analysis if enough people vote this up, and agree w/ the idea. Thanks for letting me share my analysis. Cheers.

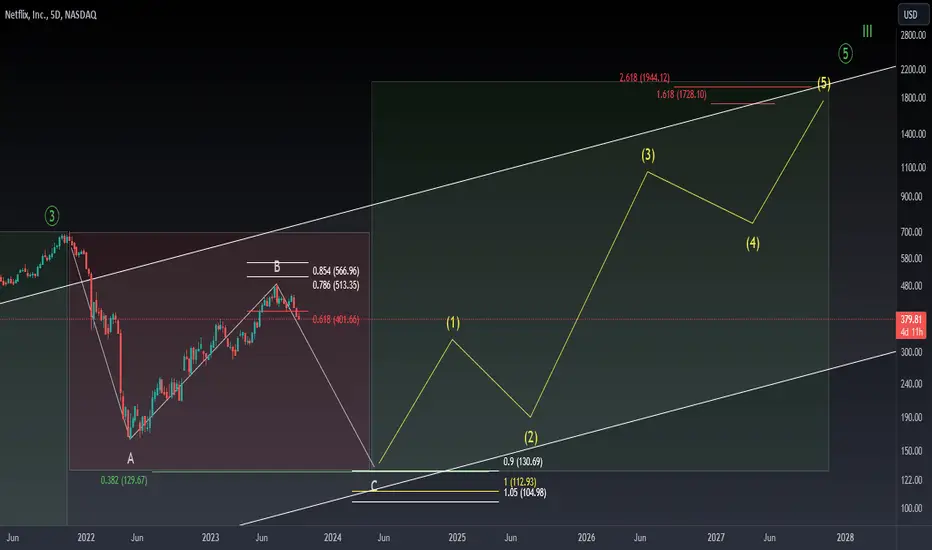
NFLX: Impulsive move C to the downside (ABC-correction)Netflix made an lower high at the 0.618 and 0.786 Fib Retracement
Looking for an impulsive move down to complete the ABC-correction and Primary wave 4
Targets are 0.382 Fib retracement of Primary wave 3 and 0.9 - 1.05 Fib extension of wave A
Next impulsive move up will complete Primary wave 5 and cycle degree wave 3
NFLX Monthly Chart... 5 trading days to go before the close of the month... which means this last bearish candle that broke the current uptrend can still reverse... let's wait and see.. but currently it is quite bearish... adding the doji that occurred at the .618 Fibonacci retracement level (in red), the RSI not even reaching 60 before reversing and the MACD histogram starting to break down.
Zoom out and NFLX is still on a major long term uptrend... even if the price would drop substantially.

Looking for a potential shark to formThis would also line up perfectly with a great support...
This could be beautiful. Time will tell.

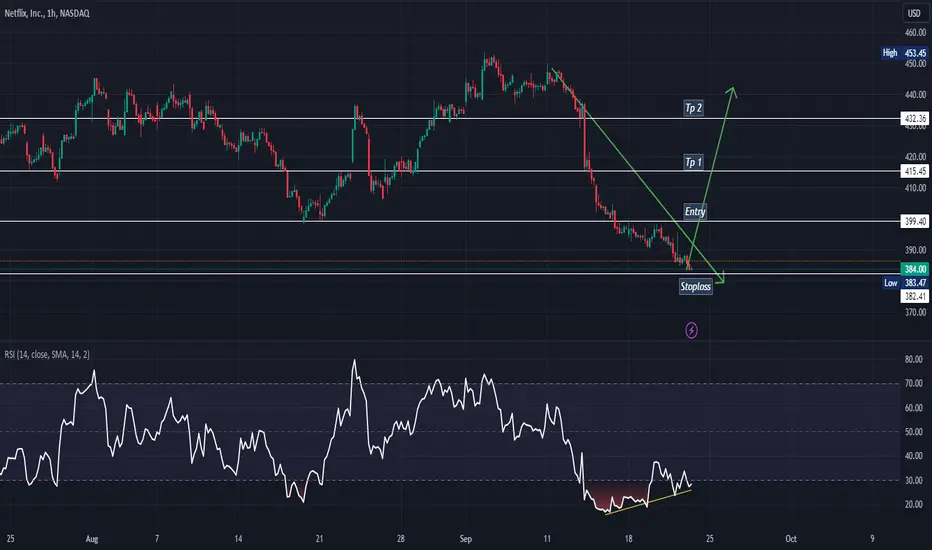
NFLXNFLX is in bearish trend but a big bullish divergence shown in bottom of the trend which we will hope that the trend will be reversal from here..
We further confirm if it breaks the last LH and made first HH.