NFLX AnalysisPrice has taken the liquidity at 321.28 and is trying to push higher. Despite that, price has built sell-side liquidity again. My bias is bullish for this ticker. However, there is a possibility that price takes the sell-side liquidity first before going higher, taking the buy-side liquidity in this consolidation.
NFLX trade ideas

NFLXGetting tight here in this pennant
Inside the pennant Nflx is pushing up against the white trendline. A break over 331 and I like calls to 337
Pennant Support at 325.
A breakover 339 and my first target is 346 gap close
A break below support and we head to 317
The setup looks bullish here even though we may test support early in the week .

NETFLEX IS IN SIDEWAYS TRENDNETFLEX IS IN SIDEWAYS TREND so will be trading supports and resistance.

Netflix in the rising channelOn the chart we can see a rising channel. We expect that the price will retest the upsloping support trendline which would be our entry in long position.
From there we expect the price to go higher and eventually retest the upper boundary of the rising channel.
Invalidation of this thesis would be if the price breaks and closes below the upsloping support line.

$NFLX with a neutral outlook following its earnings #StocksThe PEAD projected a neutral outlook for NASDAQ:NFLX after a negative under reaction following its earnings release placing the stock in drift D with an expected accuracy of 72.73%.

NFLX daily chart neutral bias.A couple levels I'm watching for this week. Looking bearish on the daily rejecting off the
21EMA with a long wick after earnings miss and the EMAS are about to cross. However, on the weekly chart we have a hammer candle with a nice wick down to the 21EMA and bounce back up to the 9EMA. Will be looking to play this either way. 319 is a big support zone to watch, a break could lead to a retest of the lower trendline around 300 level. ALSO watching 331 resistance level to play off of. Break of this level could lead to a retest of the upper flag trendline 340 area.

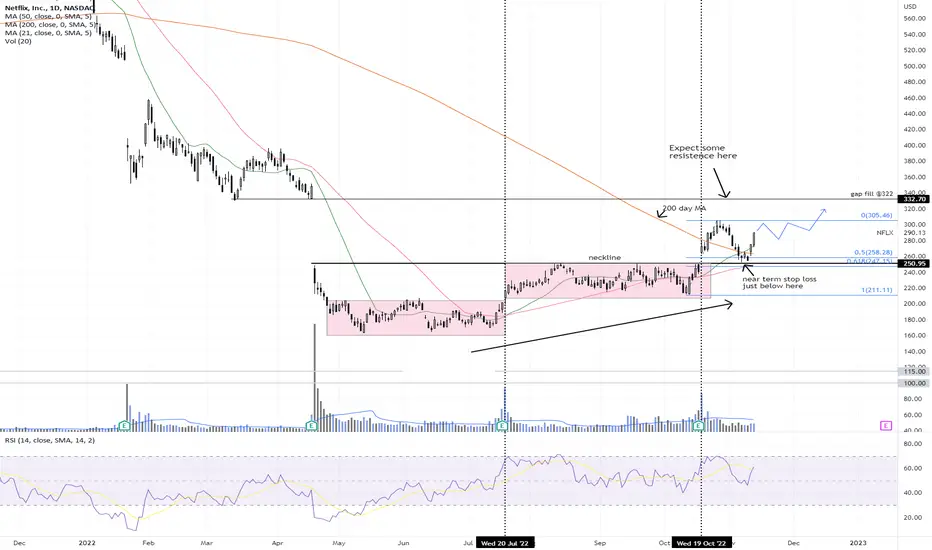
NFLX - uptrend NFLX fell 77% from it's peak before finding bottom @ 162.71 on 12 May 2022. It began to trade sideways for the next few months until it propelled out of this range on 20 July after earnings beat. After this, it again traded sideways in this new higher range for the next 3 months until another earnings beat on 19 October that finally propelled it above a rather significant neckline @ 251.
1 week+ after the breakup. it began a steep pullback that brought it all the way back to the neckline before rebounding strongly from there.
By now, it is clear that NFLX has turned the corner and is in fact now above it's 200 day MA (potential Golden Cross on the horizon).
Buy the dips going forward and trail protective stops up accordingly. Expect some resistence as it approach a major gap fill @322 area.
Disclaimer: Just my 2 cents and not a trade advice. Kindly do your own due diligence and trade according to your own risk tolerance and don't forget that money management is important! Take care and Good Luck!
$NFLX - Supply & Demand SetupTextbook S&D setup.
1. Aggressive sell off back in April 2022 giving away the sellers' presence at the highlighted price threshold.
2. The price retraces with slower momentum back to the supply area previously identified.
3. No trigger yet, but if you pull the lower time frames you'll see that the uptrending structure verified since July 2022 is now seeing steeper swing lows, failing to make higher swing highs and a break a close below the current swing low would be a trigger to look for as the greenlight for a bearish trade.
Remember that despite the slight edge that price action analysis confers, at the end of the day, reality is too complex to fit in this or in any other box.
Therefore anything can happen tomorrow.
Therefore you need to focus first, and foremost in managing risk.
Cheers,
Tenacious Tribe - Backtested Trading Strategies & Studies

What Happened With NFLX Today?We experienced some increased momentum today, so what's the fuss all about? Let's discuss the upcoming and trending news with Netflix this month.

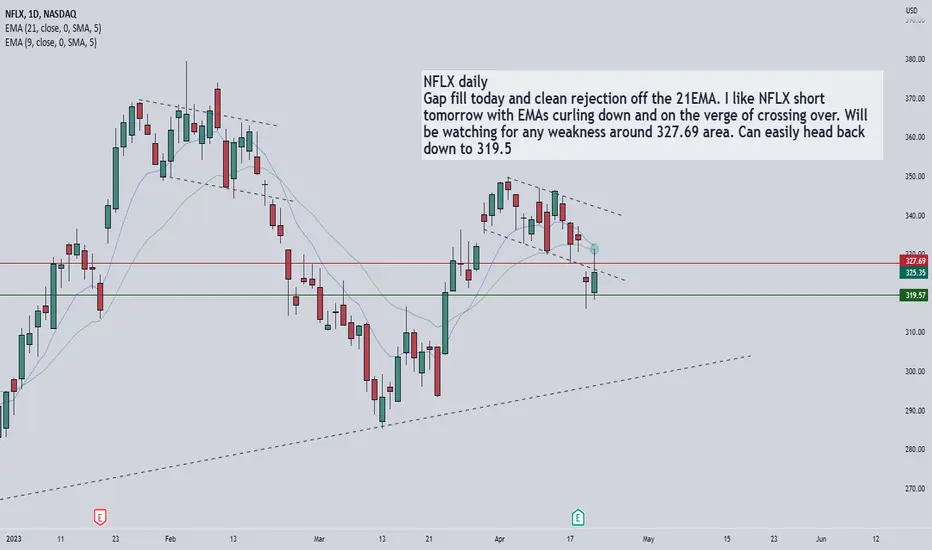
NFLX time to short?NFLX daily
Gap fill today and clean rejection off the 21EMA. I like NFLX short tomorrow with EMAs curling down and on the verge of crossing over. Will be watching for any weakness around 327.69 area. Can easily head back down to 319.5
Netflix - Where to Post-Earnings?I postulated the possibility of a large drawdown in Netflix in my last post below (with a mathematical price target) and believe the probability for this event has increased post-earnings as it did not gap-up or move substantially higher.
Invalidation of the Inverse Cup & Handle / arguably a Head & Shoulders would occur for me with the stock trading above April 4th's high (349.80).
Note the stock printed a daily hammer candle after the plunge this morning and could see a bounce before further resuming to the downside. A better short entry would be on the upside gap fill during a bounce in the next few trading days.
(No Position Currently)
04/17
Distribution occurring going in to earnings. Inverse Cup & Handle (1 could make a case for a head & shoulders).
~290 neckline.
369 conservative top of the cup.
369-290 = 70.
290-70 = 220 IC&H target.
No position. I do not recommend gambling on an earnings direction as this stock is highly volatile. This is strictly an exercise in charting. Earnings could either immediately invalidate this structure with a massive gap-up over the high of the handle or accelerate its validation with a miss or poor outlook.


Updated Netflix Bearish StructurePT: 211 - 220
Updated chart and bearish structure + price targets.
Whether viewed as a head & shoulders or inverse cup & handle, the target to complete the structure remains the same.

$NFLX puts playso NFLX has rejected off the all time fibs and has seen support at pink fibs so gonna play puts on the pink fibs

Netflix head and shoulders!A premature bearish pattern is forming, risky to get short now but reward would be large. Good luck!

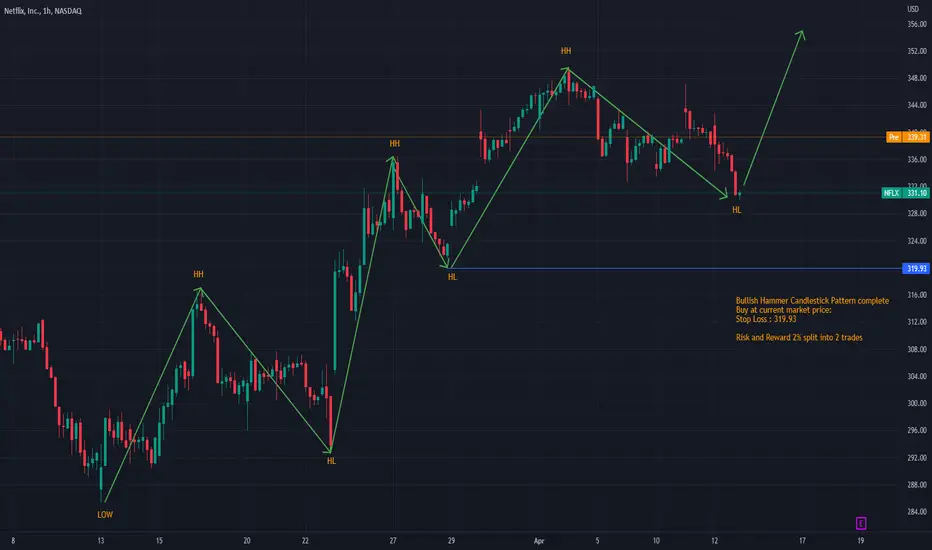
NFLX bullish trend at 1 Hours chartas per my analysis bullish candlestick pattern is completed at 1 hour time frame and can be a good buy entry at this level.
Netflix dumps and pumps after earningsYesterday, after the market close, Netflix reported its earnings for the 1st quarter of 2023. The tech giant missed analysts’ expectations, resulting in a quick and sharp selloff of nearly 12%. However, this move lasted only three minutes before the price started reversing to the upside. Within the next hour, shares erased all of their early losses.
The company posted $1.305 billion in net income, showing a decline of 18.3% YoY (in 4Q22, Netflix reported a net income of only $55.284 million). Revenue stood at $8.161 billion, up approximately 3.7% YoY and 4% QoQ. Operating income fell by 13% YoY. In addition to that, the average paid memberships rose by 4% YoY, with the company reaching 232.50 million global streaming paid memberships.
In 1Q23, Netflix launched paid sharing in four countries, and in the second quarter of 2023, the company plans to expand this service into more countries, including the USA. Furthermore, Netflix seeks to improve its revenue from advertisements and currency operations. For 2Q23, Netflix forecasts revenue of $8.2 billion, representing a 3% increase YoY. The company also expects to return $1.6 billion in operating income for the same period. Netflix shares are up approximately 105% since their low in May 2022 and about 16.5% year-to-date.
Other important information
The company’s operating income declined for four consecutive months in 2022 - 1.972$ billion in 1Q22, 1.578$ billion in 2Q22, 1.533$ billion in 3Q22, and 550$ million in 4Q22. The same applies to the net income in 2022 - 1.597$ in 1Q22, 1.441$ billion in 2Q22, 1.398$ billion in 3Q22, and 55$ million in 4Q22. In the first quarter of 2023, Netflix saw a significant rebound in both of these metrics.
Illustration 1.01
Illustration 1.01 portrays the 1-minute chart of Netflix stock. The yellow arrow indicates market close, which coincided with the release of the company’s financial results. Within the first three minutes following the announcement, shares dropped nearly 12% before erasing all losses.
Illustration 1.02
Illustration 1.02 displays the daily chart of Netflix stock. Yellow arrows indicate previous earnings, which were accompanied by a similar negative reaction in the price of shares.
Please feel free to express your ideas and thoughts in the comment section.
DISCLAIMER: This analysis is not intended to encourage any buying or selling of any particular securities. Furthermore, it should not be a basis for taking any trade action by an individual investor. Therefore, your own due diligence is highly advised before entering a trade.

NFLX earnings. IV crush game plan8.7% implied move on earnings and sitting flat in AH. Both calls and puts will be smoked tomorrow. I’m going to try and capture the opening move with light size. Risky but the cons can move over 100% in seconds. Watching the key levels outlined in the chart.

I think NFLX is a sell NFLX although beating estimates, I feel like a short term sell off is about to happen. I have been analyzing earnings and from my analysis, I’ll be shorting NFLX for awhile here

$NFLX - At cross roads#NFLX is at cross roads. MACD is about to do bearish crossing and price is sitting on 20 DMA midway Bollinger band. Overhead resistance is $376.00 and support is $300.00. Very strong support at $250.00.
It could consolidate between $376.00 and $300 area for a while.

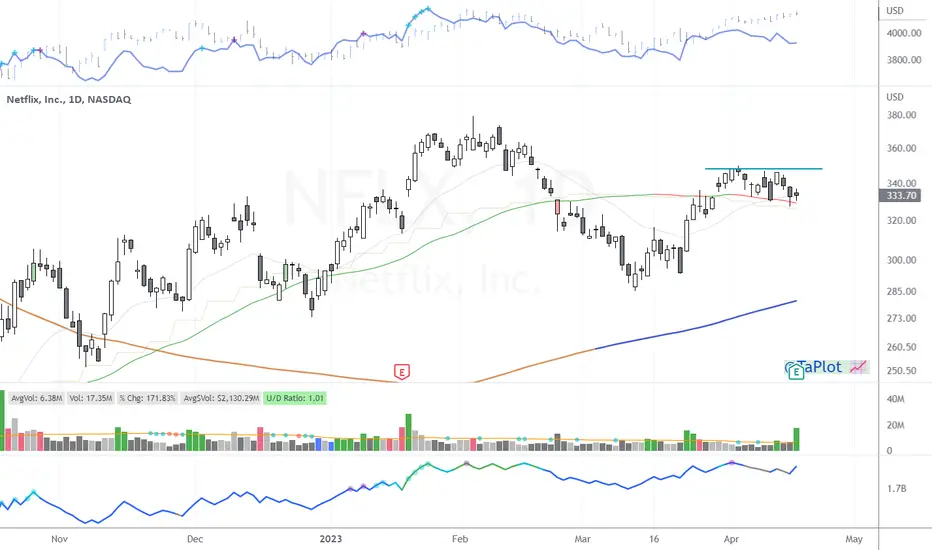
NFLX a name we all knowHere is a name we all know and a previous leader NASDAQ:NFLX
Had a 75% drop from its highs. Trying to get back into stage 2.
Volume pattern looks healthy.
More of a watch item for me that actually trading it.
Curious to see how this base develops.
Nflx bullflag?Nice bullflag forming here before earnings.
Weekly chart looks like an ascending triangle forming
If this bullflag plays out, we'll see 370 here and a pullback in may.May.
Of course with it being earnings anything can go and if things go south , this bullflag will turn into a double top
So what will it be , 308 or 370?
10% move either way

