Nvidia Update New levels to the downside Longs and shortsIn this video I discuss the market structure shift in Nvidia and highlight new levels to be aware of to the downside . Potential here for longs and shorts .
Tools used Fibs, Gann Square , Speed Fan , Order blocks .
Please Like and comment if you have any questions . Have a great Day and thanks for your support
NVDA trade ideas

Nvidia (NVDA) Share Price Continues Bearish TrendNvidia (NVDA) Share Price Continues Bearish Trend
Earlier this month, our analysis of NVDA's share price led us to:
→ Establish a downward channel (marked in red).
→ Suggest that the lower boundary could act as support, which was confirmed (circled).
On 13 March, we anticipated the median line of this channel might serve as resistance, and yesterday’s ~5% drop in NVDA’s share price (marked by a red arrow) aligns with this scenario.
As a result, NVDA’s price has declined by approximately 17% since the start of 2025, despite being a market leader in 2024.
Why Did Nvidia (NVDA) Shares Drop Yesterday?
Market sentiment turned negative amid concerns that the Trump administration may soon impose previously delayed international trade tariffs.
Additionally, the Financial Times reported that Chinese regulators are encouraging firms to adopt data centre chips that meet stringent environmental standards. This raises concerns that Nvidia’s H20 chip, despite complying with U.S. export controls, may not meet China’s environmental regulations. Investors seemingly viewed this as a bearish signal for Nvidia’s future sales in China.
Technical Analysis of Nvidia’s Share Price
Currently, NVDA’s price is encountering resistance at the bullish gap formed on 12 March, around $112.50.
Given the broader market context, this setup could indicate an attempt by bears to resume the downtrend after a temporary rebound from oversold conditions. A consolidation pattern in the form of a narrowing triangle (marked in red) has also emerged.
If market conditions remain challenging, bears may push NVDA’s price towards the psychologically significant $100 level.
This article represents the opinion of the Companies operating under the FXOpen brand only. It is not to be construed as an offer, solicitation, or recommendation with respect to products and services provided by the Companies operating under the FXOpen brand, nor is it to be considered financial advice.

NVDA BUY @106.84On the 4-hour chart, NVDA is oscillating at a low level. Currently, we can pay attention to around 106.84 below, which is a buying position for a potential bullish bat pattern.

NVDA Breakdown Confirmed! Will 110 Hold or Will Bears Target 105🔻 Technical Analysis (TA) – Intraday View
Current Price: ~$112.20
* NVDA suffered a Break of Structure (BOS) from the rising wedge pattern.
* Price broke below key CHoCH and consolidation areas, and is now hovering just above major PUT support near $110.
* Volume on breakdown was heavy — bearish pressure is strong, but we are approaching a potential reversal zone.
Indicators:
* MACD: Bearish, but histogram is slowing → early signs of bearish momentum loss.
* Stoch RSI: Oversold, starting to curl up → bounce attempt possible if support holds.
🔐 Key Levels to Watch
Support:
* 110 → Strong GEX PUT support & 2nd PUT Wall.
* 105 → 3rd PUT Wall + prior demand zone.
* 104.77 → Swing low — a break here opens the door to 100 psychological level.
Resistance:
* 115 → Highest negative NetGEX zone (put support flipped resistance).
* 119 → Previous HVL & key breakdown level.
* 125.09 → CALL wall & prior rejection area.
🧠 GEX & Options Flow Insights (TanukiTrade Pro)
* GEX Sentiment: 🔴🔵🔴 — Bearish bias overall
* IVR: 21.4 (low)
* IVx avg: 52.5 → Traders not aggressively pricing future volatility
* CALL$%: 11.1% — Weak call flow suggests downside hedging still dominant
* PUT Pressure Zones:
* 110 → High dealer support zone
* 105 → 2nd critical wall
* Gamma Resistance: 119 → strong reversal zone if a bounce occurs
📌 This setup shows potential for a short-term bounce, but overall bearish gamma structure still dominates.
🛠️ Trade Setups
📈 Bullish Setup – Reclaim 115 After Holding 110
* A bounce from 110 may attract dip buyers for short squeeze toward 119
* Entry: Above 113.50 with volume
* Target 1: 115
* Target 2: 118.50–119
* Stop-Loss: Below 110
* Options Play:
* Buy Apr 12 $115 Calls
* OR Call Debit Spread: Buy $112.5 / Sell $120
📉 Bearish Setup – Breakdown Below 110
* If 110 fails with momentum, flush to 105 becomes likely
* Entry: Break below 110 with confirmation
* Target 1: 105
* Target 2: 100 (psych level)
* Stop-Loss: Above 112.5
* Options Play:
* Buy Apr 12 $105 Puts
* Bear Put Spread: Buy $110 / Sell $105
🧭 Final Bias & Outlook
* Bias: Bearish unless 115 is reclaimed.
* Strong breakdown structure, bearish GEX sentiment, and low IVR suggest continued weakness unless we see buyer absorption at 110.
* If 110 breaks, expect increased put gamma pressure to drag toward 105 or lower.
📛 Disclaimer: This analysis is for educational purposes only and does not constitute financial advice. Always manage risk carefully and do your own due diligence.

Where to buy NVDA based on previous cyclesPresented without comment.
Interested to see how this pans out, but previous cycles have both been of similar length and had roughly 50-60% pullbacks, so IF we see a repeat of previous cycles here, then the ideal buy point would be roughly in October as shown.

NVDA breaking supportSince June of last year NASDAQ:NVDA has been developing a $113 support level. Today we saw a retest of this level with strong momentum in accordance with a weakening market. I believe the Stock will break this level and continue down to its next significant support level at $96. Technically, the stock is bouncing off of a return to its 21 EMA below the 50 EMA which would have been the optimal entry point on this trade. Today also had a cross below the 14-day SMA in RSI. Finally, looking at the technical indicators provided by Trading View the stock is showing sell or neutral signals across all indicators except for 1.

NVDA Bear may not be done chewing it up...NVDA looks like it's resuming it's downtown after a temporary recover. I'm watching to see if we get close to $100 again. If so, the door could open for $90 or even $85.
The rising wedge could still be in play here.
Good Luck & Trade Safe.

NVIDIA ANALYSISI have analyzed Nvidia using the trend , Candle pattern & Gann method. It is weak and it will break. Target is given as Apple.

NVDA LEVELS ENDING MARCHNVDA LEVELS
Been watching as beginner for a while. I like the levels I a lot
Looking to trade dips to expand on DCA method and building a portfolio steadily but working to catch up for lost time.

NVDA channel long entrynvda from 120 to 140 w/ 115 SL
invalidated w/ NQ<~20000 or one trump tweet! lol

will the NVDA downtrend break? NVDA is in a downtrend since the start of 2025 but I can see us pushing higher to 128.07, might reject or breakout from there I'm not sure yet 👁️
if we break the downtrend the rally to 144 can happen in days, boost and follow for more ⚡

130 seems like a clear path way target areaAt least to say that the 130 area is comfortably uncertain, but that's after it gets there. The reason is solidly a 100/200 cross and an exhausted oscillator, and as soon as the heikin is triggered, it could be the retest, but comfortable with this setup as we see it thus far.

NVDA at Critical Reversal Zone! Decisive Moves Ahead? Here's the latest detailed breakdown of NVDA on the 1-hour timeframe, emphasizing key reversal zones detected.
📈 Technical Analysis (TA):
* NVDA currently consolidating at around $121, showing signs of indecision at this upper reversal (green) zone, indicating potential profit-taking or reversal.
* Clear bullish structure with a recent Break of Structure (BOS) above $120, but momentum is fading slightly as shown by MACD trending lower.
* Critical bullish reversal support zone (red) detected clearly at $115-$116. A retest of this area could offer a potential entry for longs if buyers step in.
* If price loses momentum at the current resistance area ($121), watch for a retracement to test key support at the identified lower red reversal zone.
📊 GEX & Options Insights:
* Strongest gamma wall and highest positive NET GEX located significantly higher at $130. This remains a key upside target if bullish momentum resumes strongly.
* Immediate resistance at the 2nd call wall at $122 is currently acting as overhead pressure. Further bullish continuation requires a clear breakout above this level.
* Notable PUT support established at the $110 level, providing substantial downside protection if NVDA retraces sharply.
* IV Rank notably low at 11.2%, indicating low premium and relatively low volatility environment, favorable for strategic debit spread setups or long calls/puts based on directional bias.
💡 Trade Recommendations:
* Bullish Scenario: Consider long positions if NVDA holds above $120.50–$121 zone with a breakout confirmation targeting $124 initially, then $130.
* Bearish Scenario: Short-term put options could be favorable if rejection is confirmed at the current green reversal resistance around $121, targeting the red reversal support area around $116.
* Neutral Strategy: Potential for iron condor setups between clearly defined ranges ($115–$125), capitalizing on low IV environment.
🛑 Risk Management: Keep stops tight around recent highs or lows depending on directional bias. Watch volume and MACD closely for confirmation.
Trade carefully and stay alert!
Disclaimer: This analysis is for educational purposes only and does not constitute financial advice. Always do your own research and manage your risk before trading.

NVDA watch $123: Golden Covid + Golden local fibs key resistanceNVDA launched from our Golden Genesis zone at $113.
Now testing major resistance with Golden Covid at $122.
Looking for dips to buy or Break-n-Retest to confirm bottom.
Previous Analysis:
============================================================
.

NVDA on downward channelLooks pretty nice chart formation with downward channel. Price needs to break above channel for any further rally otherwise the correction will further bring down the price below $100 again.
I personally see the trade on only after breaking the channel with good volume only.

NVDA - Melt up & Crash series [2]Has conducted first test if ichmoku cloud on weekly so will likely bounce (2nd time = break probability increases)
Successfully backtested a breakout line
Plenty of room to run on RSI
Measured move of bull channel aligns to fib 2.618
Not financial advice.

NVIDIA Under Pressure: Bearish Storm IntensifiesFundamental and Technical Signals Suggest Potential for Deeper Corrections
NVIDIA Corporation (NVDA) is under significant pressure, mirroring the broader bearish sentiment gripping global equity markets. The semiconductor giant's shares have suffered a substantial 23% decline from their January peak at $153.13, illustrating vulnerability amid macroeconomic uncertainties and sector-specific headwinds.
Fundamental Drivers Fueling NVDA's Decline
Despite NVIDIA's long-term growth narrative fueled by its dominance in artificial intelligence (AI) chips, graphics processing units (GPUs), and data centre technologies, short-term headwinds are challenging the bullish sentiment. Rising interest rates, persistent inflationary pressures, and geopolitical tensions have undermined investor confidence, triggering broader risk aversion in technology stocks.
Furthermore, weakening consumer electronics demand has adversely impacted GPU sales, affecting revenue projections in the gaming and consumer sectors. Heightened competition, particularly from AMD and Intel, coupled with regulatory scrutiny over NVIDIA's proposed mergers and acquisitions, has also raised investor anxiety. This combination of slowing revenue growth and market uncertainty significantly constrains upward momentum.
Technical Breakdown Signals Further Weakness
From a technical standpoint, NVIDIA's share price remains firmly entrenched in bearish territory, encountering strong resistance at the critical 124-131 zone on the weekly timeframe. The failure to reclaim this crucial zone underscores the dominance of bearish momentum, signalling potential further downside risks.
After the decisive breakdown from the symmetric triangle pattern around the $142 mark in mid-February, sellers gained the upper hand. Since then, price movements have consistently formed lower highs, reinforcing the bearish outlook. The significance of the 124-131 zone, formerly strong support turned resistance, cannot be overstated—only a clear and sustained breach above this area would shift sentiment back toward recovery.
Crucial Support Levels Under Threat
Currently, NVIDIA is precariously supported by the 113-106 zone. Technical indicators highlight the vulnerability of this area, making it a pivotal threshold for short-term price action. Failure to maintain support here could catalyze another wave of selling pressure, accelerating the descent toward the next key support zone between $95 and $89.
Investors must closely monitor these price dynamics. A breakdown through this level would intensify bearish momentum, potentially opening the doors for an even deeper pullback. Such an outcome would align with broader market conditions that remain unfavourable for growth stocks.
Ultimate Downside Targets
Should bearish momentum continue unabated and broader market conditions deteriorate further, the long-term technical landscape suggests that NVIDIA could test even lower levels. In the event of a prolonged bearish scenario, the ultimate downside target lies within the 78-60 price range. Such a scenario would represent a substantial correction and likely reflect broader market turmoil extending beyond the semiconductor sector.
Strategic Investor Considerations
Investors should remain vigilant given the precarious technical structure and challenging fundamental backdrop. Protective measures such as stop-loss orders, portfolio hedging strategies, and position sizing adjustments may be prudent at this juncture. Staying informed on upcoming earnings reports, macroeconomic developments, and shifts in Federal Reserve policy will be crucial to managing risk effectively.
Conclusion
NVIDIA's stock price is navigating treacherous waters, influenced by macroeconomic uncertainties and bearish technical signals. Downside risks will remain significant until a decisive break above the 124-131 resistance is achieved. Investors must remain prepared for the possibility of deeper corrections, especially if broader market sentiment deteriorates further. Vigilance and strategic risk management will be essential as we approach critical support tests in the weeks ahead.

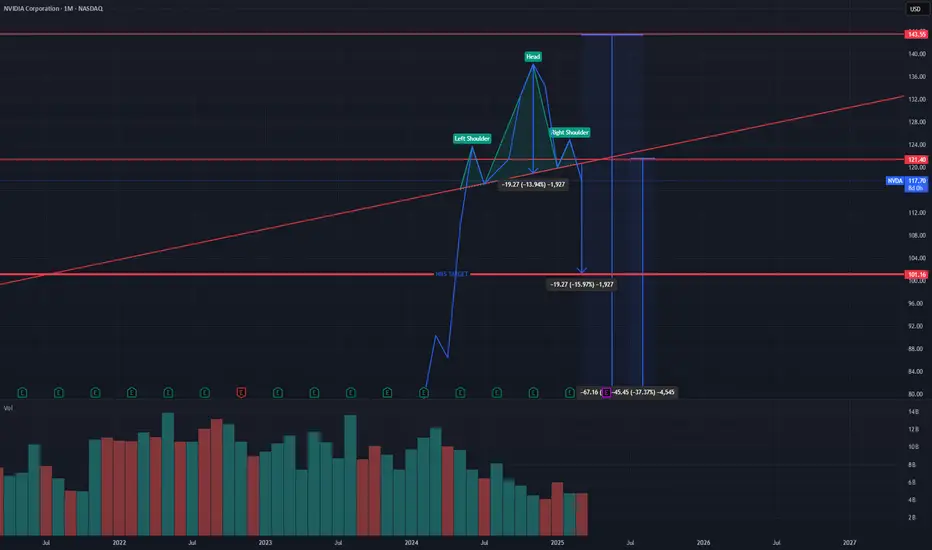
$NVDA H&S on Monthly...Linking previous short of NVDA. The right shoulder is technically not finished forming. However that trendline was tested not long ago.... will it hold? Who knows.
First target would be ~$100. If this plays out there will likely be a larger mark down phase consisting of retail panic selling. This will push toward $80 with a possible shakeout near the low/mid $70s before a long term accumulation process begins by big money.
Just because I am short on the stock does not mean I don't believe in the company or stock longer term. Have money on the sidelines to buy incase this plays out.
AAPL, NVDA, MSFT & XPS: High-Probability Trade Setups This WeekWeekly Trade Radar & Market Outlook
This week, my focus is on AAPL, NVDA, MSFT, and XPS. There could be a potential retest of the 200 SMA with AAPL and MSFT, offering opportunities for well-structured trades. NVDA looks weak and has already tested the 200 SMA, making it a candidate for further downside potential or a short-term bounce. Additionally, Chinese developments in AI chip production remain a factor that could influence price action, particularly with NVDA. Staying aware of these key levels and macro developments is crucial for trade execution.
📚 Trading Plan: Ichimoku & 200 SMA Monthly Options Strategy**
📌 Strategy Objective
This strategy aims to capitalize on **high-probability trend-following setups** by using the **Ichimoku Cloud and 200 SMA** for confirmation while trading **monthly options contracts** to minimize time decay risks.
📀 Trading Rules
✅ 1. Entry Timing Rules (Your 3 Golden Rules)**
🚫 **No trading on Mondays** (Avoid weekend gaps & false breakouts).
🚫 **No trading on Fridays** (Avoid weekend time decay & volatility).
⏳ **No trades before the first 15-minute candle closes** (Avoid market noise).
📊 Setup & Trade Criteria
🔹 2. Trend Confirmation Using Ichimoku & 200 SMA
Bullish (Call Trade) Criteria:
✅ **Price is above the 200 SMA** (bullish bias).
✅ **Price is above the Ichimoku Cloud** (strong uptrend).
✅ **Tenkan-sen is above Kijun-sen** (momentum confirmation).
✅ **Chikou Span is above price from 26 candles ago** (historical trend alignment).
✅ **Future Cloud is green** (trend continuation signal).
Bearish (Put Trade) Criteria:
✅ **Price is below the 200 SMA** (bearish bias).
✅ **Price is below the Ichimoku Cloud** (strong downtrend).
✅ **Tenkan-sen is below Kijun-sen** (momentum confirmation).
✅ **Chikou Span is below price from 26 candles ago** (historical trend alignment).
✅ **Future Cloud is red** (trend continuation signal).
🔹 3. Entry Triggers (After First 15-Min Candle Closes)**
**Bullish (Call Trade) Entry:**
- Price pulls back to **Kijun-sen** and holds support, then starts to bounce.
- OR price **breaks above the Ichimoku Cloud** and holds.
- ✅ Enter **Call contract (monthly expiration)**.
**Bearish (Put Trade) Entry:**
- Price pulls back to **Kijun-sen**, rejects resistance, and starts falling.
- OR price **breaks below the Ichimoku Cloud** and holds.
- ✅ Enter **Put contract (monthly expiration)**.
🔹 4. Selecting the Right Option Contract
✅ Monthly expiration contract (third Friday of the month).
✅ 30-60 days to expiry (avoid rapid theta decay).
✅ Strike Price:
- **ATM (At-The-Money) or slightly ITM (In-The-Money)**.
- Delta between **0.55 – 0.70** for balance between premium & movement.
✅ Liquidity Criteria:
- **Open Interest > 1,000** for easy fills.
- **Tight bid-ask spread** (<$0.10 on liquid stocks).
🎯 Risk Management & Trade Management**
🔹 5. Stop Loss & Take Profit Rules**
Stop Loss (SL):
🔴 For Calls: Below the Kijun-sen or most recent swing low.
🔴 For Puts: Above the Kijun-sen or most recent swing high.
Take Profit (TP):
✅ First Target: At the opposite edge of the Ichimoku Cloud.
✅ Second Target: Key support/resistance level based on price action.
✅ If profit reaches 70-80% max potential, close early** to avoid theta decay.
---
🔹 6. Trade Adjustments**
🔄 Rolling:If trade is profitable near expiry but hasn’t hit full target, roll to next monthly contract.
🔄 Cutting Losses: Exit early if price **closes inside the Ichimoku Cloud** (loss of trend strength).
📊 Trade Example: Bullish Call Play**
- Stock:** AAPL
- Current Price:** $190
- Bias: Price is above 200 SMA and Ichimoku Cloud
- Entry Trigger:** Price pulls back to Kijun-sen and bounces
- Option Contract:
- Expiry: **Next monthly contract (e.g., July 19 expiration)**
- Strike: **$190 ATM Call**
- Delta: **0.60**
- Bid/Ask Spread: **$2.00 / $2.05**
- Entry Price: $2.05
- Stop Loss: Below Kijun-sen (~$187)
- Take Profit:
- First TP at $195 (Cloud resistance)
- Final TP at $200 key resistance
🔹 7. Why This Strategy Works?**
✅ **Avoids weak setups by following strict entry rules**.
✅ **Uses monthly contracts to avoid rapid time decay**.
✅ **Combines trend-following confirmation from Ichimoku & 200 SMA**.
✅ **Ensures liquidity & better risk management with ATM/ITM options**.
📀 Final Notes
🔹 Only trade **Tuesday to Thursday** to avoid low-probability days.
🔹 Wait for **first 15-minute candle to close** before entering.
🔹 Stick to **monthly contracts** for better theta control.
🔹 **Follow trend confirmation rules strictly**—no guessing.
Turning a Small Trading Account into a Side Hustle for Financial Freedom
Imagine having a skill that allows you to generate income from anywhere, with nothing more than your phone, iPad, or laptop. No need for an expensive setup, no need for hours glued to a screen, and no need to risk everything on a single trade. This is the power of trading options with a small account—starting with as little as $500 and scaling up over time to create financial security, eliminate debt, and build leverage for larger investments.
Weekly Trade Radar & Market Outlook
This week, my focus is on AAPL, NVDA, MSFT, and XPS. There could be a potential retest of the 200 SMA with AAPL and MSFT, offering opportunities for well-structured trades. NVDA looks weak and has already tested the 200 SMA, making it a candidate for further downside potential or a short-term bounce. Additionally, Chinese developments in AI chip production remain a factor that could influence price action, particularly with NVDA. Staying aware of these key levels and macro developments is crucial for trade execution.
Trading Method: Ichimoku Cloud & 200 SMA Strategy
For trade setups, I rely on a combination of the Ichimoku Cloud and the 200 SMA to confirm entries and exits. This system provides a structured approach to trading by identifying trend direction, support and resistance levels, and potential breakouts.
Identify the Trend – The 200 SMA serves as the key trend indicator. If price is above, we look for long opportunities; if below, short setups take priority.
Ichimoku Confirmation – Price action should align with the cloud structure:
Bullish trades: Price above the cloud with strong momentum.
Bearish trades: Price below the cloud with confirmation of weakness.
Entry Timing – Trades are entered after the first 15-minute candle closes to avoid early market volatility. No trades on Mondays or Fridays to maintain consistency and avoid false breakouts.
Monthly Options Contracts – Focusing on monthly expirations allows for strategic entries with enough time for price movements to develop.
Risk Management – Stop losses are set just below key Ichimoku or 200 SMA levels, ensuring a disciplined risk-reward ratio.
How This Can Work as a Side Hustle
Many people look for side hustles to supplement their income, but most involve long hours, additional expenses, or require significant effort to scale. Trading options, however, offers:
✅ Minimal time commitment – With the right plan, you spend less than an hour per day analyzing and placing trades.
✅ Low startup cost – Start with as little as $500 and build from there.
✅ No physical inventory or overhead – You don’t need to buy and store products.
✅ Scalability – As your account grows, you can increase contract size and compound gains.
✅ Financial freedom potential – The profits from consistent, disciplined trading can be used to pay off debt, invest, or build long-term wealth.
The Power of Leverage: Using Trading to Build Wealth
The ultimate goal of trading isn’t just to make a little extra cash—it’s to create financial leverage. Here’s how smart traders use small account growth to create lasting financial success:
1️⃣ Get Out of Debt – Use profits to pay off credit cards, student loans, or other financial burdens. Imagine the freedom of being debt-free.
2️⃣ Reinvest in Larger Opportunities – Once your small account grows, you can scale up your trades, fund larger investments, or even start a business.
3️⃣ Build a Safety Net – Having extra cash flow from trading can serve as an emergency fund, helping you navigate life’s unexpected challenges.
4️⃣ Create a Path to Full-Time Trading – For those who love the process, this side hustle can evolve into a primary source of income over time.
It’s About Discipline, Not Just Trading
The key to successful trading isn’t the market—it’s you.
Many traders fail because they lack the discipline to follow a system. This approach isn’t just about making money; it’s about becoming the kind of person who can execute a plan without emotion, without impulsiveness, and without shortcuts.
Success in trading mirrors success in life: patience, discipline, and consistency always win.
Getting Started – No Excuses
You don’t need a fancy setup. You don’t need to be a finance expert. You just need a phone, iPad, or laptop, a brokerage account (I use Robinhood for its simplicity), and a commitment to mastering a system that works.
If you’re looking for a low-stress, high-reward way to build financial security, trading options with a small account might be the perfect opportunity. It’s time to take control of your future—one trade at a time.

NVDA Long Term Bullish by V lineI’ll looking to buy shares around 110-105
First TP 128
Second TP 134
Third TP 141
Looking Plan to buy shares: 40-30-30 Or 50-30-20

nvda buy alert it bounced to a low or new high at every vertical line and it finally found support at the last blue vertical line

Buying Opportunity Amid Correction?Technical Analysis: NVIDIA has completed a bullish Elliott Wave cycle, reaching a high of $153.13 (wave V). It is currently in a corrective phase, with a recent drop to $116.72. Key support levels to watch are $105.88 and $81.16, which could be attractive levels for a long-term entry. If the price drops to $81.16 (50% retracement), it could be a buying opportunity, as NVIDIA has historically bounced from important support levels. Longer-term, a new bullish cycle could take the price toward $183.20, but it must first complete this correction.
Market Context: The market has experienced recent declines due to macroeconomic concerns, such as inflation and interest rates, along with an investor rotation toward defensive sectors. The technology sector, including NVIDIA, has been particularly affected by fears of weaker chip demand and elevated valuations.
Fundamental Outlook: Despite the correction, NVIDIA remains a leader in AI, gaming, and data centers. Demand for its artificial intelligence GPUs remains strong, and its market position is solid. However, investors should be aware of macroeconomic risks and competition in the semiconductor sector.
Recommendation: For long-term investors, the $105.88 and $81.16 levels could be attractive entry points, with a long-term target of $183.20. However, it is recommended to wait for confirmation of a rebound from these supports and monitor market conditions. For short-term traders, the current volatility could offer trading opportunities in both directions.
#NVIDIA #NVDA #TechnicalAnalysis #Investment #StockMarket #ElliottWaves #Technology
Conclusion
NVIDIA is in a corrective phase after a significant rally, and recent market declines have amplified this correction. However, the support levels identified on the chart could offer buying opportunities for long-term investors, especially if the price drops to $81.16. Despite the macroeconomic challenges, NVIDIA's fundamentals remain strong, making it an attractive candidate for a long-term recovery.

$NVDA downside? h&s?Hello, thinking another move to $110 in the next week. Head and shoulders formed here in a downside tape?
WSL
