Hedge $PLTR... but WHY?!PLTR 5/24 Hedge Trade
NYSE:PLTR reported earnings pre-market on 5/7. After exceeding expectations, NYSE:PLTR has been range bound. An option trader most likely a hedge fund or some kind of firm created a significant wall due to purchasing too many contracts valuing over $106.7K. This may seem like a low amount especially for options but for NYSE:PLTR this is too much. I will be looking to play the hedge (bet against) the original trade and grab ITM Puts for 5/24. Only if we lose momentum top the upside
PLTR trade ideas


Palantir (PLTR) Set for a Massive Move: Why You Need to Act Now!Price Action & Ichimoku Cloud:
PLTR is trading at $21.76, showing a slight increase in pre-market action. The price is interacting with the Ichimoku cloud, indicating potential support and resistance levels. The Ichimoku cloud's leading span A (22.22) and leading span B (23.92) are critical resistance zones. The price is currently below the baseline (22.84), which is a bearish signal.
Relative Strength Index (RSI):
The RSI stands at 48.14, indicating a neutral momentum. It’s neither in overbought (above 70) nor oversold (below 30) territory. However, a level below 50 leans slightly towards bearish sentiment.
Moving Averages:
Short-term moving averages (10-day EMA: 21.68, 10-day SMA: 21.74) indicate immediate resistance, while the longer-term 200-day EMA (19.37) and 200-day SMA (19.12) suggest strong support. The interplay between these averages shows a mixed sentiment but with potential for bullish momentum if the price holds above the 50-day EMA (22.15) and SMA (22.79).
Oscillators & Momentum Indicators:
MACD: The MACD level (-0.29) and Momentum (10) at -1.57 indicate a bearish trend. Both suggest the price might face downward pressure in the near term.
Stochastic Oscillator: The Stochastic %K at 24.58 and Stochastic RSI Fast at 25.03 are in neutral zones, implying no clear momentum direction.
Volume:
The current volume of 30.03M is lower than the average volume (45.86M), indicating lower trading activity. This could signal a lack of strong buying or selling interest at the current price levels.
Pivots & Support/Resistance Levels:
Pivot Point (P): 22.13
Support Levels: S1: 20.17, S2: 18.36, S3: 14.59
Resistance Levels: R1: 23.94, R2: 25.90, R3: 29.67
Price Prediction & Trading Strategy:
Given the current technical setup, PLTR appears to be in a consolidation phase with potential for both upward and downward movements depending on market sentiment and news. The key levels to watch are the resistance at $22.13 (pivot point) and support at $20.17 (S1).
Long Position:
Entry Point: Above $22.22 (above the cloud leading span A)
Target: $23.94 (R1), with an extended target at $25.90 (R2)
Stop Loss: $20.69 (below S1)
Short Position:
Entry Point: Below $20.69 (below S1)
Target: $18.36 (S2), with an extended target at $14.59 (S3)
Stop Loss: $22.13 (pivot point)
Speculative Price Target:
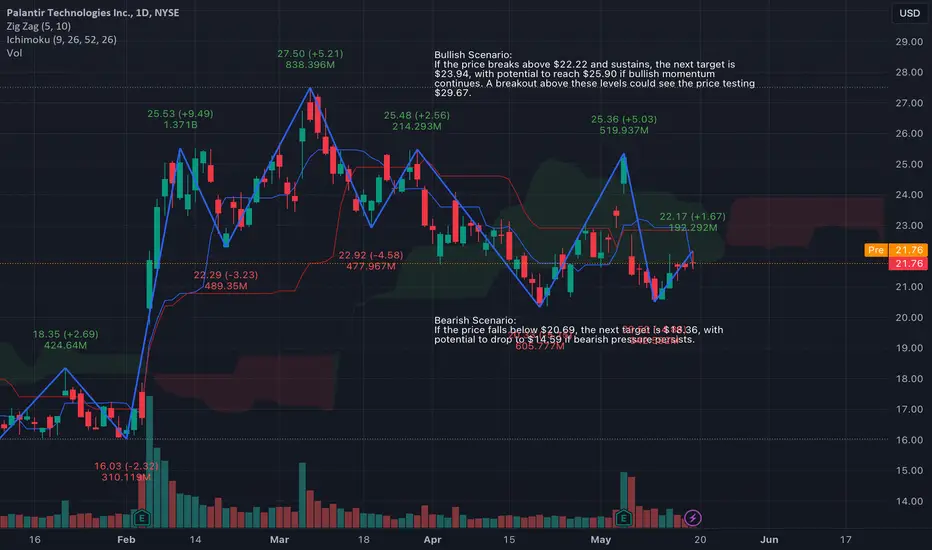
Bullish Scenario:
If the price breaks above $22.22 and sustains, the next target is $23.94, with potential to reach $25.90 if bullish momentum continues. A breakout above these levels could see the price testing $29.67.
Bearish Scenario:
If the price falls below $20.69, the next target is $18.36, with potential to drop to $14.59 if bearish pressure persists.
Recommendation:
Based on the current analysis, it is advisable to wait for a clear breakout above $22.22 or a breakdown below $20.69 to confirm the next directional move. Traders should monitor volume and news for further confirmation. The mixed signals suggest a cautious approach, with tight stop losses to manage risk.
Summary:
Current Sentiment: Neutral with a slight bearish tilt.
Immediate Resistance: $22.13 (pivot point)
Immediate Support: $20.17 (S1)
Trading Recommendation: Await breakout above $22.22 for long or breakdown below $20.69 for short. Use tight stop losses to manage risk effectively.
PLTR: Still looking for a lowPLTR stock price stabilized last week. The price action is looking like some kind of a bear flag. From EW perspective, getting another low to hit $19 would make a lot of sense. However, the price is very close to break out of $22.47, which might call for some kind of a messed up ending diagonal end and some messed up leading diagonal start, or need more time to see if the correction is taking some other shape. If price does break below, then $19- $18.5 support should be a buy for at least a decent bounce.


PLTR Bullish Note A NYSE:PLTR s a software company PLTR seems to be doing great and the past earnings weren't the exception. Even when price is down because of a less than prior quarter growth rate in commercial revenue, fundamentals seems solid with the only issue being a very high P/E ratio.
From a technical perspective, the price is resting on a strong support zone and held the current trend line that has been following from october 2023. If the price goes up above the 20 y 50 EMA I would expect it to reach 27.50 that would be the price target of the preceding falling wedge. Let's see.
Target 27.50
Stop 20.40

Double topPossibility double top forming on the 1 hour chart. The pattern should be valid as long as price rejects off of $22.

PLTR: HHHL &ChannelFundamentals:
Develops software for institutions for protect individual privacy and prevent the misuse of information. The only thing that I do not like is the bad earnings stability and the decelerating earnings; but sales have been growing q/q and y/y. Good quality funds are adding.
Technicals:
Daily:
exDiv1 with MACD lines and RSI
a-b-c counter completion right into the buy zone within a larger upward channel
Weekly:
HHHL
"b" of an a-b-c pattern within a weekly channel
Stage 3 strategy in effect...

$PLTR to $23 soon???Although it is coming off a disappointing earnings report, based on technical analysis, Palantir is poised to return to about the $23 level, representing an 8.91% increase from current prices (more if you use call options). Here's the reasoning behind my idea:
1. First off, we look at history. As depicted by the drawings, Palantir is at a very crucial and strong level of support. The area that the stock is in right now has constantly proved to be a solid area for the stock to regroup and begin climbing. This was demonstrated today, further solidifying that area as support (see yellow wick). That is a reassuring sign that it will not fall further, as long as no significantly bad news comes out. Additionally, when looking at the chart, you will notice that $23 is a key area; it swaps between support and resistance, depending on which side of $23 the stock price is on. Although there is resistance at $22, if the stock can break above that level, that would be a new line of support above the old one and allow the stock to have a solid base for a move upwards to and beyond $23.
2. The other reason I believe this stock is poised for a move upwards is that if you take a look at the chart, you'll notice that it is right at the top of an order block that has a strong level of volume. Essentially, what this means is that on any move downwards, buyers are going to pounce on it and send it back up; this happened today, as shown by the wick circled in yellow. This is reassuring because the chances of it breaking below the $20.30 zone (where the bottom of the block is) are quite low due to the two reasons explained above.
So, in conclusion, PLTR is in an excellent position for traders, especially options traders, to get in and take profit relatively quickly. I see this move occurring within the next two to three weeks and feel that this is an excellent trading opportunity. Thanks to everyone who read this far and good luck trading, I hope you enjoyed!

Plantir Needs to RefuelContrary to the recent comments from James Cramer that he "liked" Plantir, every stock has its season ... and appears it's Winter time for this one ... and simply "liking" a stock doesn't mean you should buy it!!
I charted this guy out in about 10-15 minutes after a large iced mocha ;)
Inspiration early in the morning is key; just say'n.
Using key Fibonacci retracement and extension levels, Fibonacci circles, relevant correlative trend lines to build out the channels ... it's easy to see how the proper technical analysis, removing emotions, identifying key channels, identifying key patterns, etc. anyone can come up with a non-emotional stock charting strategy.
I see TOO many people trading on emotion ... get busy building your OWN strategy, quit watching the worthless news, quit taking other people's advice (except for mine) and "do your OWN homework".
AND, just don't take my chart for granted. Pick it apart, piece by piece, and really understand the details of WHY and WHAT and WHERE. Dare you.
Appreciate any feedback ! AND, enjoy every sandwich along the way!

PLTR, Equal Opportunities to go UP/DOWNIT's strange that this can go UP/DOWN, no definitive path for now.
There is a Gap UP/DOWN
No enough volume to decide
Below 50-day EMA
Below VWAP
MACD also confused
Its better to wait before stepin

PLTR - Correction incoming?We can now count a very nice 5 waves move up from the Dec 2022 low. While there is currently no sign that price has topped, it has hit a major monthly resistance level at around $26.50. Confirmation that a correction has begun would occur when price breaks below the ascending trend line.
Should a correction take place in the coming months, price should at least retest previous support at $13.83 and potentially the $10.27 level which is around the 0.618 retracement level of the 5 waves up

PLTR: What is this craziness?PLTR price action has gone crazy this week. First, the H&S pattern failed when $19 target failed and pushed above the neckline; creating an inverse H&S pattern. The target for inverse H&S pattern almost got hit, but then the post earning shenanigans began. Price has fallen through the neckline once again and if the last low of $20.20 breaks, then it will be enroute to test 0.618 fib retracement area of $15.29.
In the grand scheme of things, anywhere between $15 to $17 would be a fantastic buy area. If we are fortunate, then this correction would extend, and price will get down to the golden pocket $10.5 area. It could take the rest of the year to play out, but I will start to accumulate shares and setup some option plays to get my bag going. I think the fundamentals of the company remains unchanged and long term it is a triple digit stock. So, anything is a gift and DCA is the way to go.

Bearish Gartley on PLTR 15 minute.This is not financial advice. PLTR likes Gartleys. Let's see if this plays out. Good short opportunity on CD PRZ.
#PLTR

5/6/24 - $pltr - too risky to play upside, sidelines for me5/6/24 - vrockstar - not gonna short this b/c i agree w the bulls on the "LT" here... but nearly 20x sales, pretty forecastable model and unlikely to "smash" raise limits my interest in a heady tape. keep in my any big upside probably gets distributed/ sold down (there's your short if so inclined/ possibly ex post). any miss or growth reset dumps this 20% minimally per other B2B names with decent hits and not by "enough". i'm targeting a buy only sub $20, but better in the mid teens level. sidelines for me. if i owned it, i'd be selling some upside (for insane IV) or trimming off the top. perhaps another way to go long if you're inclined is selling some P's but the location I'd like it doesn't pay enough to take that risk in case it's a bigger miss/ horrible tape tmr and i get captured at 20$ and stock is trading 17-18$ which is where i see "worst case miss", and i'd rather own shares not be trapped down 2$/shr.

pltr longearnings today and cup and handle formed. possible move up to previous highs with green market. Personally i doubt it going to 40 soon. but technicals showing that area
just learning the technical analysis and this is just a post for educational purpose

PLTR - Bullish into earnings Monthly SSL swept
Monthly FVG with a bullish CHoCH holding
Targeting BSL at $29 & std 4 at $34

PLTR - Slow Turtle Buy after pullback retestFirst Slow turtle buy after pullback retest 20.
Weekly chart triggers Fast Turtle Buy confirming Bullish Harami reversal candle
Weekly Chart ->
Retailer weakening. Banker MA staying above Retailer MA
and Retailer MA is curving Downward. Both are good sign for Bull Rally.
FiFT +ve but still LOW.
Can start putting focus back on this ticker.
Start with Hourly Slow Turtle Alert buy setup or BoD around 21-22
Support around 20

PLTR Palantir Technologies Options Ahead of EarningsIf you haven`t bought PLTR before the previous earnings:
Then analyzing the options chain and the chart patterns of PLTR Palantir Technologies prior to the earnings report this week,
I would consider purchasing the 23usd strike price Calls with
an expiration date of 2024-5-17,
for a premium of approximately $1.99.
If these options prove to be profitable prior to the earnings release, I would sell at least half of them.

PALANTIR bottomed on this Inverse Head and Shoulders pattern.Palantir (PLTR) easily hit our $24.50 target last time we published a call with you here (February 06 2024, see chart below) and shortly after started to correct:
The price has now hit and rebounded on the 4H MA200 (orange trend-line), forming so far an Inverse Head and Shoulders (IH&S) pattern, which is technically a bottom formation. This is the very same pattern that was formed on both previous bottoms of the 1-year Channel Up.
On top of that, it broke and re-tested the Lower Highs trend-line, which again on both previous bottoms, it was a successful buy signal. In addition, the 1D RSI rebounded on the 1-year Support Zone.
We are currently on that exact time within the 4H MA50 (blue trend-line) and 1D MA50 (yellow trend-line). A closing above the latter, should be the final buy confirmation. Our medium-term Target is $29.00 which represents the 1.236 Fibonacci extension, which was where the November 21 2023 Higher High was priced.
-------------------------------------------------------------------------------
** Please LIKE 👍, FOLLOW ✅, SHARE 🙌 and COMMENT ✍ if you enjoy this idea! Also share your ideas and charts in the comments section below! This is best way to keep it relevant, support us, keep the content here free and allow the idea to reach as many people as possible. **
-------------------------------------------------------------------------------
💸💸💸💸💸💸
👇 👇 👇 👇 👇 👇

PLTR with bear flagPLTR has a bear flag on the daily much like IWM. Starting to break bear off this.

PLTR - Second Slow Turtle Signal This year.Weekly chart Uptrend, Bullish and Strong Bull.
No sign of bearish divergence.
Pullback with lower volume after previous second slow Turtle Buy signal this year.
MCDX Banker dominating the chart and Bull FiFT is strong.
Bull is health as long as the price stay above 17.
Plan to further buy at 20-22 zone.

Cathie's Ark Invest Buys Palantir Stock Ahead Of Q1 Earnings Cathie Wood's Ark Invest, renowned for its bold investment strategies and forward-thinking approach, made significant moves in its portfolio ahead of Palantir Technologies Inc.'s ( NYSE:PLTR ) Q1 earnings announcement. With an eye on emerging trends in AI and technology, Ark Invest seized the opportunity to bolster its holdings in Palantir ( NYSE:PLTR ) and other key stocks, signaling confidence in the companies' growth prospects.
Strategic Accumulation of Palantir Stock:
Ark Invest's ARK Autonomous Technology & Robotics ETF (ARKQ) initiated a flurry of trades, acquiring a substantial number of Palantir shares in anticipation of the company's first-quarter results. The purchase of over 100,000 shares, coupled with additional acquisitions from previous sessions, underscores Ark's bullish stance on Palantir's AI-driven solutions and their potential to drive future growth.
Anticipation for Palantir's Q1 Earnings:
As Palantir ( NYSE:PLTR ) prepares to unveil its Q1 earnings on May 5, analysts project positive results, with expectations of increased earnings per share and revenue compared to the previous quarter. Ark Invest's strategic accumulation of Palantir ( NYSE:PLTR ) stock ahead of the earnings announcement reflects confidence in the company's ability to deliver strong financial performance amidst growing demand for its innovative technologies.
Diversified Portfolio Expansion:
In addition to Palantir ( NYSE:PLTR ), Ark Invest diversified its portfolio with strategic investments in Meta Platforms Inc. (formerly Facebook) and Roku Inc., seizing opportunities presented by market fluctuations. Despite market volatility, Ark Invest remained undeterred, capitalizing on the sell-off of Roku shares to acquire a significant stake in the streaming equipment maker, demonstrating conviction in its long-term growth prospects.
Embracing the Electric Vehicle Revolution:
Ark Invest also expanded its footprint in the electric vehicle (EV) sector, shifting focus to BYD Co. Ltd., a prominent player in the EV market. With Warren Buffett's Berkshire Hathaway holding a stake in BYD, Ark Invest's investment in the company underscores confidence in its potential to disrupt the EV landscape and contribute to ARKQ's portfolio growth.
