RIVN trade ideas

Rivian RefreshMan, Rivian deserves to sit lower than this based on financials and returns, but if this market has one more long leg in it to exhaustion of overbullish idiots, well, then this is the path.

RIVN TargetI did this for GOTU one time and it actually exceeded the target. Anyways, equal length arrows for the bear flag target, which comes to around $12.5
Probably won't tank as fast as the initial drop, but the end target is usually close. Of course, the end play here is probably bankruptcy which is zero.
25k vehicle production, trading at half the market cap of GM and Ford. The market is stupid.

Buy RIVN cheaper than George SorosBillionaire investor George Soros bought a $2 billion stake in electric truck startup Rivian in the quarter ended Dec. 31.
His average should be around $100.
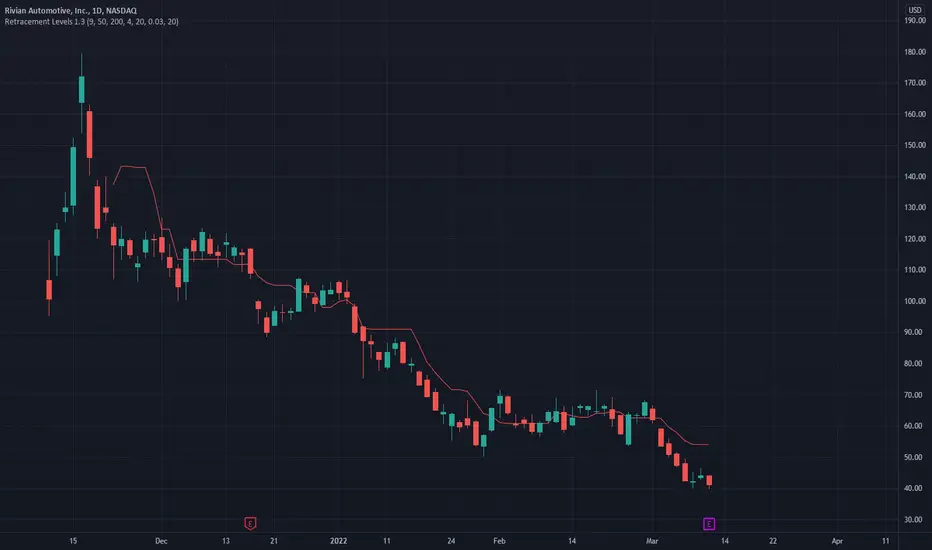
RIVN 52 Week Range $37.50 - 179.47, today hitting all time low.
I see this as a potential buy opportunity.
My price target is $65.
Looking forward to read your opinion about it.

Rivian All Time LowRivian NASDAQ:RIVN is at an all time low right before earnings. "I want to own some of this company" is my general thesis as they build out their infrastructure sans sales. We'll see if this contrarian buy of shares pays off...
How far Rivian Could go ???(2)On December 9th, 2021 when RIVN was 116.5 I put the target on 60-40 in the next couple of months..!
11 days after that I recommended shorting RIVN would be the best among TSLA, LCID, and RIVN..!
Today RIVN touched 39.86..!
But I think it will go lower after the earning because it did not sell anything..!
Why?
Because it did not produce anything to sell..!
I think it will experience single-digit prices in 2022..!
For short opportunity let first people cover the previous shorts in March..!
Best,
Dr. Moshkelgosha M.D
DISCLAIMER
I’m not a certified financial planner/advisor, a certified financial analyst, an economist, a CPA, an accountant, or a lawyer. I’m not a finance professional through formal education. The contents on this site are for informational purposes only and do not constitute financial, accounting, or legal advice. I can’t promise that the information shared on my posts is appropriate for you or anyone else. By using this site, you agree to hold me harmless from any ramifications, financial or otherwise, that occur to you as a result of acting on information found on this site.

How Low Rivian could go???I think the RIVN chart pattern is very similar to HOOD and it could follow the very ae pattern and experience a sharp constant drop to 60-40 in a Bearish case..!
You may think you have bought the next Tesla but Rivian can not be the next Tesla..!
You can see the most important support (green lines) and resistance (red lines) to watch in the coming days in these charts!
Best,
Moshkelgosha
DISCLAIMER
I’m not a certified financial planner/advisor, a certified financial analyst, an economist, a CPA, an accountant, or a lawyer. I’m not a finance professional through formal education. The contents on this site are for informational purposes only and do not constitute financial, accounting, or legal advice. I can’t promise that the information shared on my posts is appropriate for you or anyone else. By using this site, you agree to hold me harmless from any ramifications, financial or otherwise, that occur to you as a result of acting on information found on this site.

New Target for RIVNWhen I compared Rivian with Hood 43 days ago it was 115, I set my target for 60 and now with the current momentum, I think there is potential to go to 30-40 or even lower!
Best,
Moshkelgosha
DISCLAIMER
I’m not a certified financial planner/advisor, a certified financial analyst, an economist, a CPA, an accountant, or a lawyer. I’m not a finance professional through formal education. The contents on this site are for informational purposes only and do not constitute financial, accounting, or legal advice. I can’t promise that the information shared on my posts is appropriate for you or anyone else. By using this site, you agree to hold me harmless from any ramifications, financial or otherwise, that occur to you as a result of acting on information found on this site.

Rivian price action on the reversal of the market to longFib channel projection is an estimate, but it's based on all the key trend lines and levels that were tested on the way down. Safe investing in anything would wait for the spike and the pull back into April or May for buying. Purchasing the next dip is a "catching the knife" scenario. However, Rivian is showing a strong accumulation. The final push will be unclear. But I think my chart is accurate and will be going in at 35 or so.

What are your thoughts????? Worth what the IPO was?????I would like to hear others thoughts on this....I'm 100% in GGPI before I would be in RIVN...What about you????

$RIVN - Ready to Make New LowsEarnings were not kind to $LCID.
Lucid Group cut its car production forecast for this year by as much as 40%.
The company cited supply chain constraints and parts quality issues for slashing production to between 12,000 and 14,000 vehicles, down from initial expectations of 20,000.
“This reflects the extraordinary supply chain and logistics challenges we’ve encountered and our unrelenting focus on delivering the highest-quality products,” Lucid CEO Peter Rawlinson said in a statement. “We remain confident in our ability to capture the tremendous opportunities ahead given our technology leadership and strong demand for our cars.”
It hasn't been much different for car companies across the world, EV or not.
This brings us to RIVN. A stock that has been cratering from its highs earlier this year. They report earnings on March 10th. The same day CPI is released. Talk about a double whammy.
Supply chain constraints remain and I expect RIVN to guide in a very similar manner to LCID. They are both in the early innings of their life cycle as companies and not as well equipped to handle inflationary and supply risks like the seasoned TSLA. Until this point I had not even mentioned the tremendous chip shortage.
Expect RIVN to only make new lows from here on out with this inverted cup and handle setup as noted above.

RIVN - bad price makes worse price
gave a false sense of breakout, and roller over quickly on a bad news. broke down the bearish pennant...almost back to the ATL.
if it can't hold 50, will keep sliding

After hours sell off - low volume but still suspiciousNASDAQ:RIVN
Bought a few 60 March 18 puts on the close. Rsi turning down. Oil price high so everyone going to buy a Rivian now? Hedge funds disclosed positions held in Q4 21 but does anyone know if in fact the positions are still active? So much hope here for a company that still hasn't brought a mass produced product to mass market. Probably won't for years and not to mention the intense competition from other manufacturers. When I see a huge market cap on little more than promises and hope for the future, I need to call BS lol.
Please like and follow!

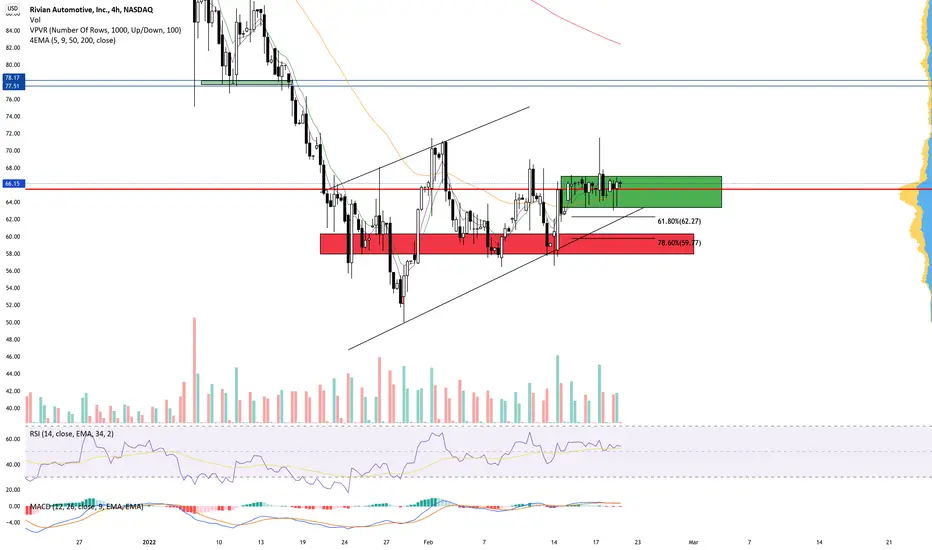
$RIVN - Trading in a channel. Looking for a break either way!$RIVN is trading in a channel. We're gonna get a bigger move once it breaks one way or the other. Looking for daily candles closing below 53.3 or above 71.

RIVN turding out on downtrend lineAlso could have a bit of bear flag formation here - but looks like it is getting ready for the next leg down to me, especially if this gravestone doji looks as it does. maybe down 40 in the coming weeks?

RivianI hopped in some at 61.33. Support as of now 60.83 main key supports 60.03 and 58,05. I have bud there also. Could be setting up!

Rivn trade recap I bought Rivn at the trend line while Spy and Qqq were at a major support. The risk to reward for Rivn is about 5-1 and with spy and Qqq at support i was even more confident in this play. I also decided to get shares instead of option contracts because the Iv on contracts where extremely high. After Rivn shot up 4 percent after I got in, I moved my stop loss to .5% in the green so if Rivn did come back down it would still be in profit.

RIVN 30m Wolfe Wave bullish A Wolfe Wave is a chart pattern composed of five wave patterns in price that imply an underlying equilibrium price. Investors who use this system time their trades based upon the resistance and support lines indicated by the pattern.

RIVN4HR Range, short opportunity to test longs near $60, breaking south of $64-$63 will trigger my pivot points.
RIVN RIVAIN looking for entry point - possible scenarioAssumption
the bearish movement starting from 180 USD is over:
Correction as ABC wave:
A ending at 107 (length 73)
B ending at 127
C ending at 50 (length 77)
--> A and C wave almost equal, this matches well
--->invalidation under 50, this would mean a longer correction in WXY for instance
This would mean, impulse wave is in formation
1st wave up to 70 USD
wave 2 ongoing, for instance as an ABC again
correction in 5 waves to 56 --> A wave
B wave leading to double top around 71
C wave ongoing in 5 waves
--> invalidation above the last highs
--> alternative: the double top is a X wave, Y wave ongoing
Possible targets for going long
gap 59,34
fibo around 57
stop under 50

Bounce off resistance to demand zone $63 shortSo far RIVN has been pretty cooperative with these short options.

Time for RIVN LongOh my. I have been dreaming of the day that I can get a good entry point on Rivian. I saw one of their cars pre-IPO and thought it was beautiful. And now I'm able to find more beauty in RIVN through this epic ascending triangle. EV is set to surge.

Human vs MachinesChart patterns detection needs an extensive learning process and experience, no matter if you are a human or a machine!
Machine Learning Workflow:
There are five core tasks in the common ML workflow:
1. Get Data
2. Clean, Prepare & Manipulate Data
3. Train Model
4. Test Model
5. Improve
Since the chart patterns, beta version indicator has been released, I started working with it to find out how it works.
In the following examples, you will see the comparison between my pattern (left side) and platform pattern (right side)!
I activate the triangle, pennant, and wedge pattern indicator..!
1- Daily chart: machines did not detect anything:
2- 4 hours chart: machines did not detect anything:
3- 4 hour charts: I changed the regular time to extended hours!
Finally, the machine detects something..!
Educational point:
There are hundreds of thousands of indicators and oscillators out there, some work, some don't!
The question is:
Are you able to use them correctly and increase their performance???
Think about it..!
Best,
Moshkelgosha
DISCLAIMER
I’m not a certified financial planner/advisor, a certified financial analyst, an economist, a CPA, an accountant, or a lawyer. I’m not a finance professional through formal education. The contents on this site are for informational purposes only and do not constitute financial, accounting, or legal advice. I can’t promise that the information shared on my posts is appropriate for you or anyone else. By using this site, you agree to hold me harmless from any ramifications, financial or otherwise, that occur to you as a result of acting on information found on this site.
