U.S. Small Caps Break Out: Dash for Trash Gathers SteamSitting in an obvious uptrend with momentum indicators skewing increasingly bullish, it looks like the U.S. small cap 2000 contract wants to go higher. The dash for trash is on!
Having just cleared the July 10 high of 2278, it’s provided a decent setup to initiate fresh longs, allowing for a stop b
Related indices

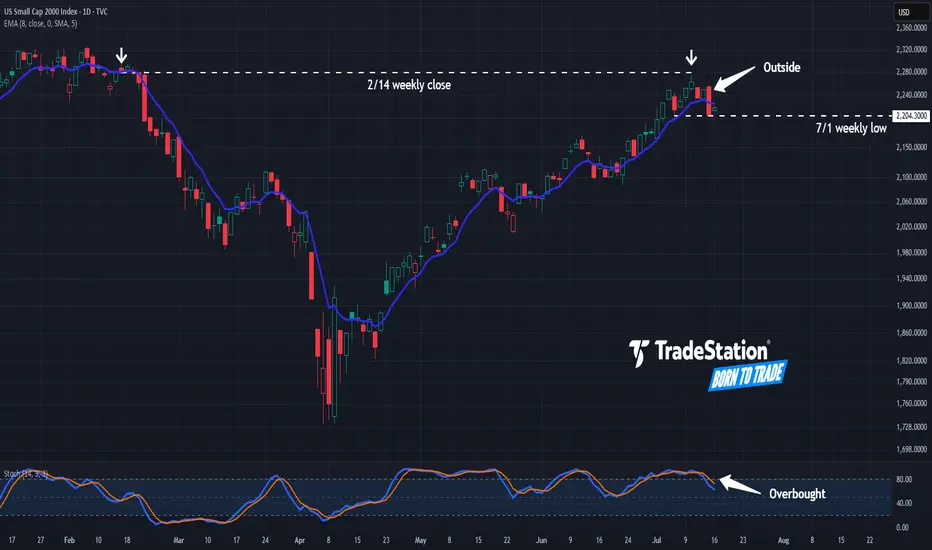
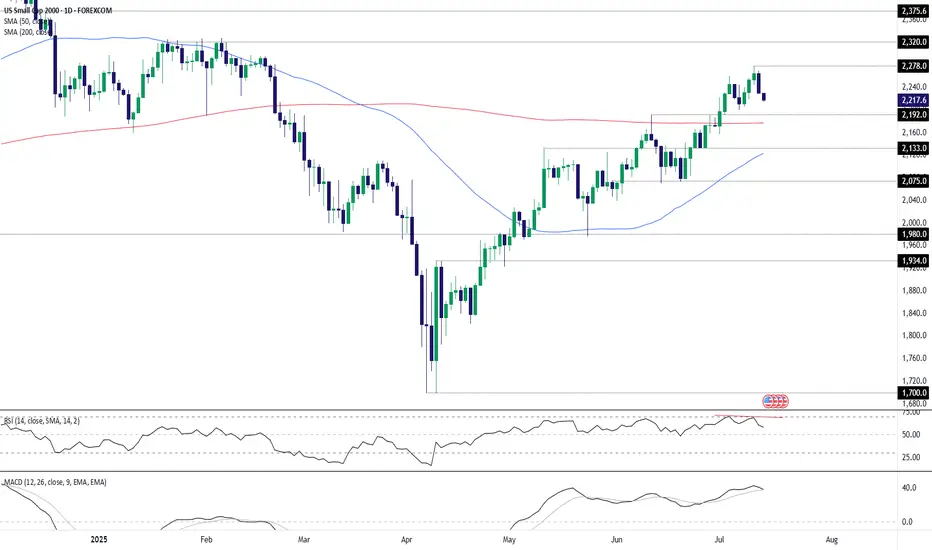
Have Small Caps Hit a Wall?The Russell 2000 has lagged the broader market for years, and now some traders may think it’s stalling again.
The first pattern on today’s chart is the February 14 weekly close of 2,280. The small cap index approached that level last Thursday but couldn’t hold. The resulting “shooting star” candles
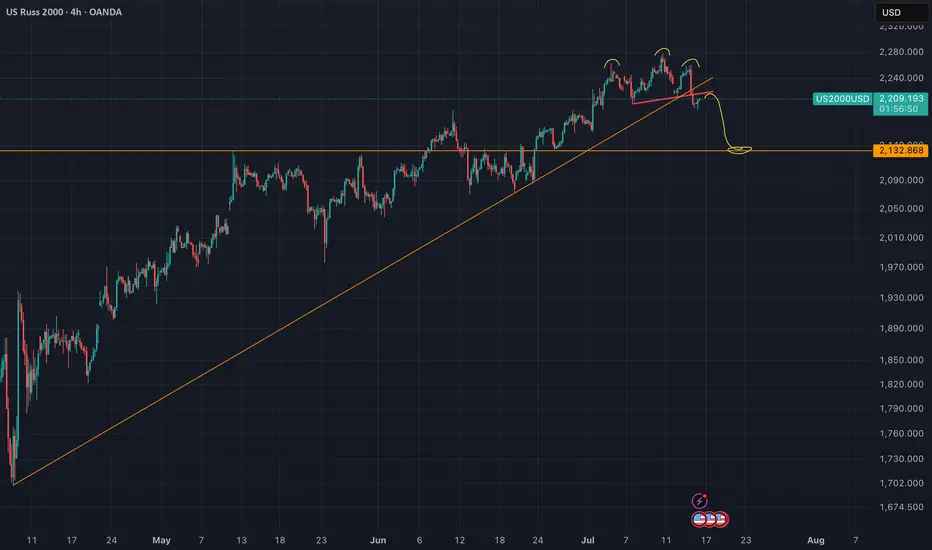
US2000 - Head And Shoulders (Top signal)Reversal in play. The neckline of the H&S got validated yesterday.
Nothing here should be interpreted as financial advise. Always do your own research and decisions.
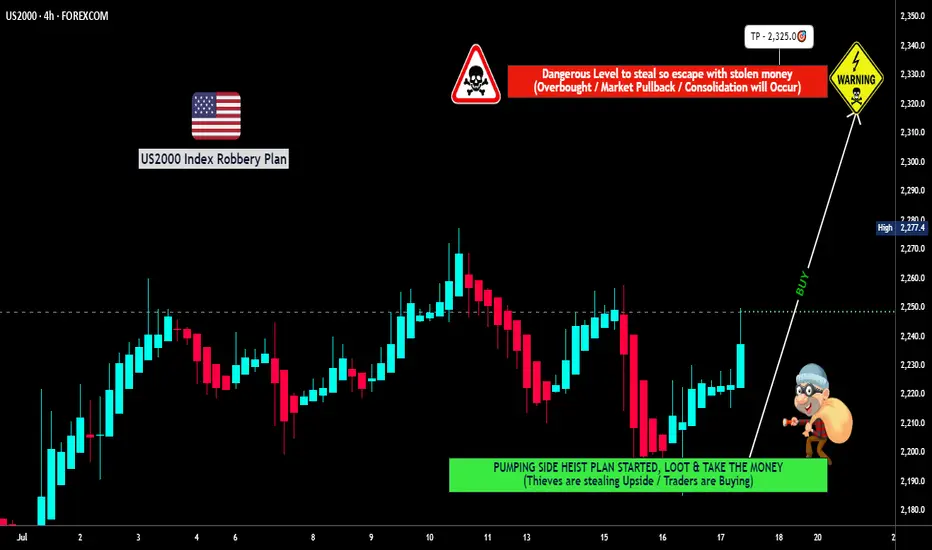
"US2000 THIEF TRADE: SWIPE & ESCAPE BEFORE BEARS!"🔥💰 "RUSSELL 2000 HEIST" – THIEF TRADING STYLE (BULLISH LOOTING IN PROGRESS!) 💰🔥
🚨 ATTENTION, MARKET ROBBERS & MONEY MAKERS! 🚨
(Thief Trading Strategy – High-Reward, Low-Risk Escape Plan!)
🎯 MISSION: US2000 / RUSSELL 2000 INDEX
(Current Market Status: Bullish Heist in Progress!)
🔓 ENTRY POINT: "THE
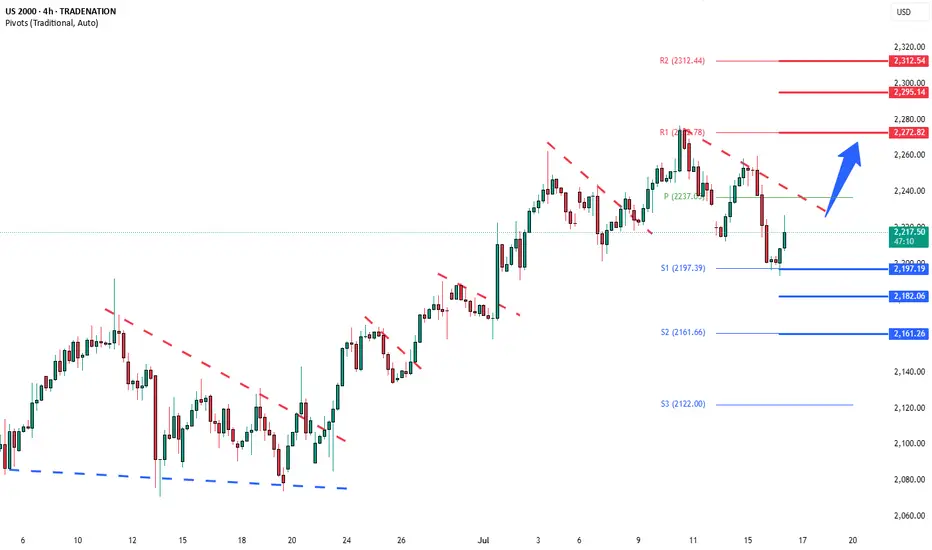
Russell2000 corrective pullback supported at 2197Key Support and Resistance Levels
Resistance Level 1: 2270
Resistance Level 2: 2295
Resistance Level 3: 2313
Support Level 1: 2197
Support Level 2: 2180
Support Level 3: 2160
This communication is for informational purposes only and should not be viewed as any form of recommendation as to a p
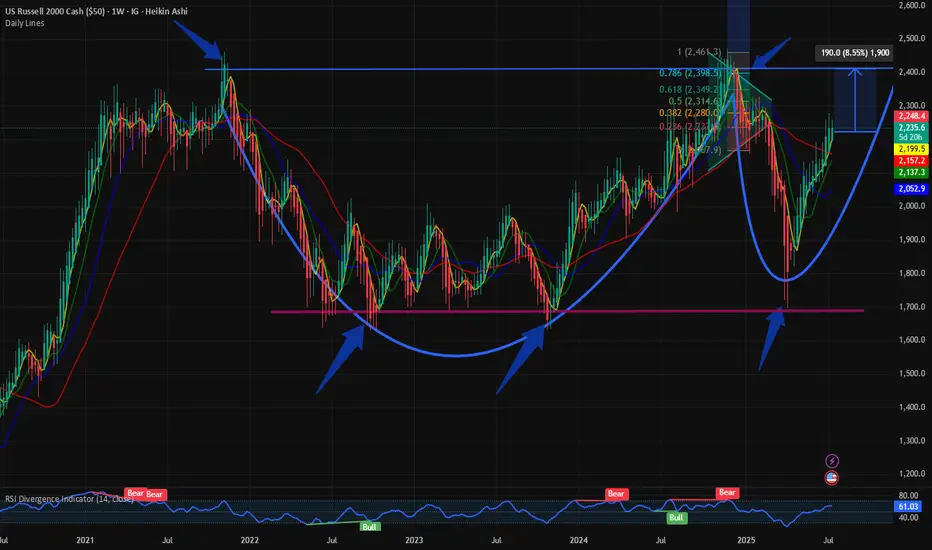
$RUSSEL: Completion of Cup and Handle formation or higher?The small cap index $RUSSEL has had a good past couple of months and has bounced back from its lows. We visited the small cap index on May 1st when we identified the trend reversal. The $RUSSEL was in the recovery mode after the Liberation Day capitulation.
IG:RUSSELL in a bounce back mode. But u
US Small Caps: Evening star pattern flags reversal riskThe U.S. Small Cap contract often generates reliable reversal signals, meaning the three-candle evening star pattern completed Friday should be of interest to traders, especially with bullish price momentum also showing signs of rolling over.
Should the price push back towards Monday’s opening leve
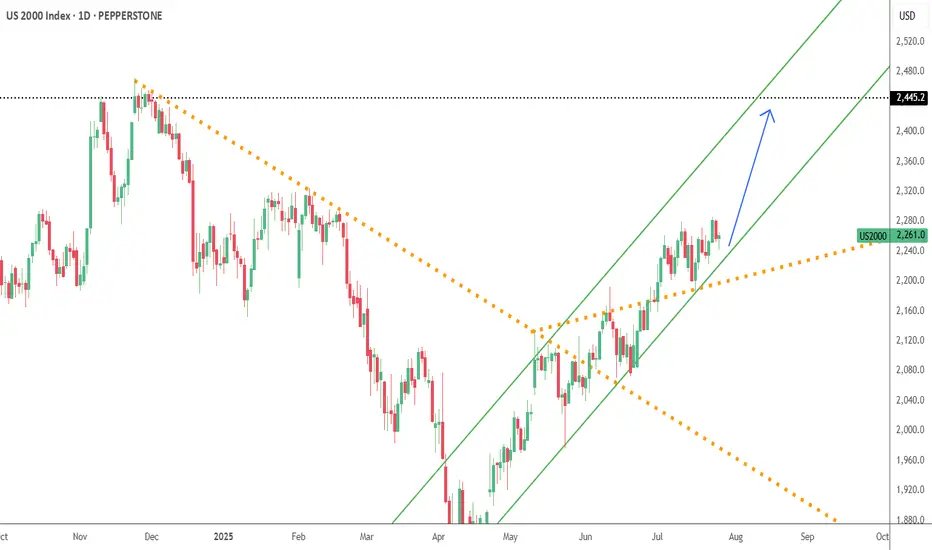
US2000--LONG--27_07_25-- Bullish trend continuation
--ascending channel
--Buy around 2249--2272
--TP around 2451
RUT Echoes IWM – The Livermore Playbook?The Russell 2000 (RUT) is painting a structure that mirrors the IWM ETF – a widening accumulation channel, setting up for a potential breakout. The VolanX protocol flags this as a classic Livermore Speculative Chart pattern, where phases of quiet accumulation lead to an explosive markup.
Channel Su

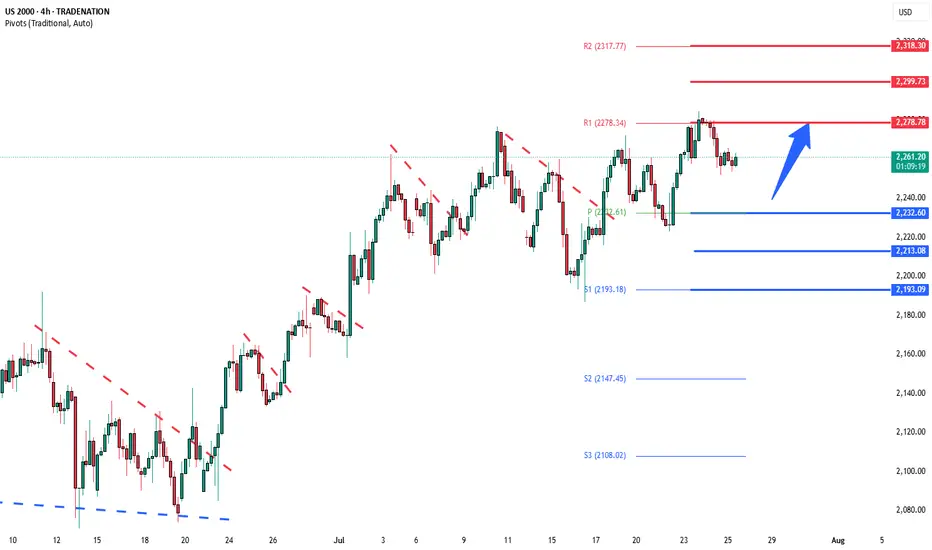
Russell2000 Bullish continuation supported at 2232.60Key Support and Resistance Levels
Resistance Level 1: 2278.80
Resistance Level 2: 2299.70
Resistance Level 3: 2318.30
Support Level 1: 2232.60
Support Level 2: 2213.00
Support Level 3: 2193.00
This communication is for informational purposes only and should not be viewed as any form of recomm
See all ideas
Displays a symbol's price movements over previous years to identify recurring trends.
Frequently Asked Questions
US Russel 2000 reached its highest quote on Nov 25, 2024 — 2,471.3 USD. See more data on the US Russel 2000 chart.
The lowest ever quote of US Russel 2000 is 105.5 USD. It was reached on Oct 28, 1987. See more data on the US Russel 2000 chart.
US Russel 2000 is just a number that lets you track performance of the instruments comprising the index, so you can't invest in it directly. But you can buy US Russel 2000 futures or funds or invest in its components.