Shopify Inc.
Short-term trend: Shopify has been in a short-term uptrend since August, following a bottom around $60. There is a series of higher highs and higher lows, which is a bullish indicator.
Long-term trend: Over a longer period, from May to July, the stock showed a downtrend but has recovered strongly. However, it hasn't reached previous highs from earlier in the year, suggesting it's still recovering within a larger range.
Support level: The stock found solid support around $60 (marked by the August low).
Resistance level: Current resistance is around $85. The price is approaching this level again after a strong bounce.
The Bollinger Bands indicate increased volatility recently, with the stock touching the upper band. This typically suggests that the price may be overbought in the short term, and a potential pullback or consolidation could occur before continuing the trend.
The recent candlestick indicates strong bullish momentum, with a gap up and a large green candle. However, since it touched the upper Bollinger Band, it would be wise to watch for signs of exhaustion or reversal.
The combination of moving averages, Bollinger Bands, and volume indicates a continuation of the bullish trend, but a short-term pullback or consolidation might occur before attempting to break resistance at $85.
SHOP trade ideas

SHOP 11%-34% increase from here Bottomed at a support, looks bullish going into nvdia earnings.
1st target is 65.46
2n target is 78.91

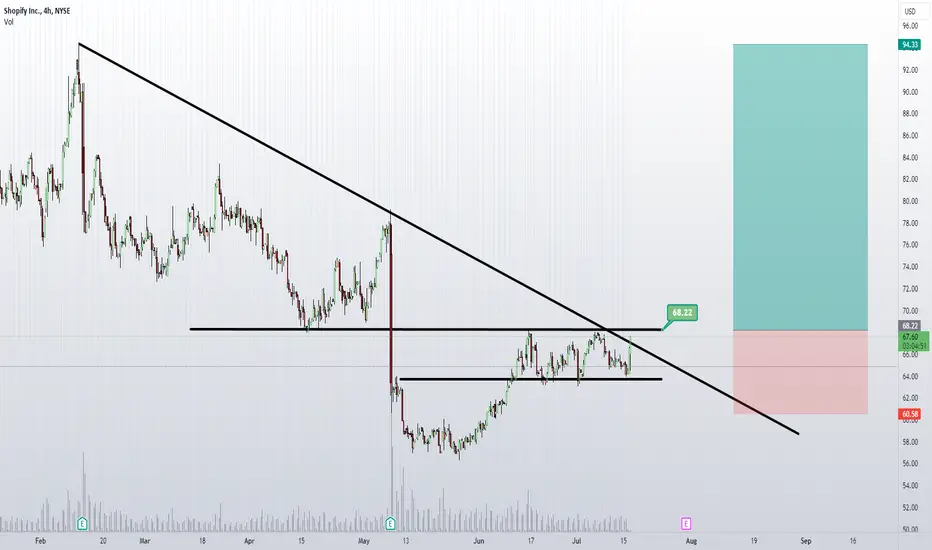
$SHOP somewhere else at these levelsI believe Shop has been running a little hot recently and can correct back to the $68 area.
Not financial advice, good luck to all :)

SHOP LONG WYCKOFF ACCUMULATIONWe already tested the zone and gave reaction, now it's the truth time . we pass or we fail
my SL is last point for SHOP to continue up trending, else we will be visiting lower areas
TP 125
SL 47

Looking for a breakout-n-retest on SHOP.🔉Sound on!🔉
Thank you as always for watching my videos. I hope that you learned something very educational! Please feel free to like, share, and comment on this post. Remember only risk what you are willing to lose. Trading is very risky but it can change your life!

Shopify (SHOP): Is It Just the Beginning?Shopify has been one of our best entries this year, and we remain very bullish on it. From a technical analysis perspective, it's hard to make a bearish case for this stock. We've even seen a change of structure after catching the bottom on SHOP.
We've already taken some profits off the table and moved our stop loss to break even for the initial trade. We're now expecting this surge to continue, and as a result, we're planning to place another limit order on Shopify, aiming to buy more if the price moves into the $59.38-$54.59 area. We prefer to enter manually to avoid getting triggered by any sudden news events.
If our analysis is correct and this is indeed Wave 2, we could see a really nice rally in the near future on Shopify, potentially breaking the $90 mark and moving even higher.
Let's see what Shopify has in store for us next.

SHOP: Resistance and supportHello,
SHOP is steadily raising and looks like at a good support.
Will it fill the gap below or above first?
But for long term, it looks good. NYSE:SHOP

SHOP - too strong on indicator on watch for upside.SHOP - Stock about to fill the gap to $76.50. Looking for calls above $77 for a move towards $80 and $83. Recently YouTube Expands Partnership With Shopify, Allowing U.S. Shopify Plus And Advanced Merchants To Join YouTube Shopping's Affiliate Program Through The Google & YouTube App. Stock is strong on indicator level as well.

Shopify Turns BullishThis stock looks good and currently preparing for a bullish wave...
Good Thursday my fellow trader, I hope you are having a wonderful day.
➖ This week, SHOP produced a very strong session. This session so far removed all the losses produced in an entire month. One single week negated four weeks of bearish action. Couple this with a strong volume breakout and you have a strong bullish signal.
➖ This week also pushed prices above multiple moving averages which is a nice extra. This gives additional support to the bullish bias:
👉 SHOP is very strong buy above 63.
Thank you for reading.
Namaste.

Despite positive earnings, $shop still going to new lows.The earnings reaction was positive today which saw shares of shop go up over 20%, however we're already fading the news.
The big picture is that we're in the process of a larger market wide correction that will bring all stocks down with it.
If we look at the chart, even with the news today, price has just formed another lower high and is setting up for a large move lower.
I don't think we'll see a bottom be put into the market until we test $31 or lower. Base case is we likely hit the two lower supports on the chart.
Let's see what happens in the coming weeks.

Shopify Surges 22% on Strong Q2 Earnings and Upbeat ForecastShopify Inc. (NYSE: NYSE:SHOP ) experienced a remarkable 22% surge in its stock price following its second-quarter earnings report, which significantly exceeded Wall Street expectations. The Canadian e-commerce giant showcased impressive growth in key financial metrics, despite a challenging consumer spending environment.
Financial Highlights
- Earnings per Share (EPS): 26 cents, surpassing the 20 cents expected
- Revenue: $2.05 billion, beating forecasts of $2.01 billion
- Gross Merchandise Volume (GMV): Rose by 22% to $67.2 billion, outpacing the $65.8 billion consensus estimate
Shopify’s success is attributed to its robust demand for services that support online merchants, including software solutions, advertising, and payment processing tools. The company's ability to navigate a mixed consumer spending landscape underscores its strong market position.
Strong Performance Amid Consumer Caution
Despite a cautious consumer spending environment, reflected in recent earnings reports from e-commerce rivals like Amazon, Etsy, and Wayfair, Shopify reported solid growth. The company’s GMV soared 22%, highlighting its ability to capture market share even as broader economic conditions impact consumer behavior.
Jeff Hoffmeister, Shopify’s CFO, remarked that the company continued to gain market share, driven by its diverse clientele and robust platform. “Our merchants are outperforming and doing better than others,” stated Shopify President Harley Finkelstein, emphasizing the benefits of the company's broad and varied merchant base.
Key Metrics and Achievements
- Merchant Solutions Revenue: Increased by 19% to $1.5 billion, driven by GMV growth and Shopify Payments adoption
- Subscription Solutions Revenue: Grew by 27% to $563 million, bolstered by a rise in merchant numbers and pricing increases
- Gross Profit: Up 25% to $1.0 billion, with a gross margin of 51.1%
- Free Cash Flow: Increased to $333 million, compared to $97 million in the same quarter last year
- Monthly Recurring Revenue (MRR): Rose 25% to $169 million, with Shopify Plus contributing 31%
Positive Outlook for Q3 2024
Shopify (NYSE: NYSE:SHOP ) provided an optimistic forecast for the third quarter. The company expects revenue growth in the low-to-mid-20s percentage range year-over-year and anticipates a slight increase in gross margin. Additionally, Shopify projects a free cash flow margin similar to Q2 2024 and expects to maintain a double-digit free cash flow margin for the remainder of the year. Shopify’s impressive performance amidst a mixed consumer spend environment highlights its strategic positioning as a leader in e-commerce solutions. By focusing on diversified merchant needs and enhancing its platform's capabilities, Shopify continues to strengthen its role in global commerce.
Industry Context
The company’s success contrasts with challenges faced by other e-commerce players, who have reported cautious consumer spending. Shopify’s ability to thrive despite these headwinds showcases its resilience and strategic advantage in the e-commerce sector.
Technical Outlook
As of the current time, Shopify stock (NYSE: NYSE:SHOP ) has experienced a notable increase of 22.3%. This significant surge is supported by a bullish Relative Strength Index (RSI) of 58, indicating the likelihood of further price escalation. Additionally, the daily price chart presents a distinct upward gap, suggesting that market dynamics may lead to this gap being filled in subsequent trading sessions.
In summary, Shopify's strong quarterly results and positive outlook reflect a company that is not only weathering economic uncertainties but also thriving in a competitive market. As it continues to expand its offerings and drive growth, Shopify remains a standout player in the e-commerce landscape.

8/6/24 - $shop - not "obvious", but buying mid $50s into EPS8/6/24 :: VROCKSTAR :: NYSE:SHOP
not "obvious", but buying mid GETTEX:50S into EPS
- best in class platform, "uber", "abnb", "amzn", etc...
- not "cheap" at 50x EPS (pick your bogey) in an ailing consumer
- but generates piles of cash (inflecting) and shy of 3% fcf yield this year but growing top line at 20% yoy is *way* better than cash
- what still concerns is the mgmt coming out and spooking with regard to short term growth. remember they're pretty exposed to SMB's which are probably most hurt in the current environment
- if you don't "need" to own it, probably still a situation where you put it on a short list and hope you get a discount into results
- but realistically this tape is bid (at least for now - more on this later - i'd not make this assuming for the coming week even, but it *is* the case now that we're risk on)... which means any reasonable number sends this up 10% and probably sticks.
- we also *did* fill the gap sub $50 (from Nov '23), even though it wasn't filled for long. worth noting.
- all in... i am probably going to sit this one out (I'm already playing NASDAQ:SMCI tn and NASDAQ:BLDE in the AM and the latter w/ a reasonably larger size 5% ha) so i'm not a lack of action here.
- but if you have the ability to add on a miss to NYSE:SHOP (e.g. you size manage correctly) b/c you have conviction in platform etc. ... you'll make money probably in the YE context buying at today's levels.
- i'm going to be a bit greedier and attempt to only dip buy any sort of growth hiccup (if/does/and not expecting it/ but let's see).
what do u think?
V

$SHOP Under $50Love entries at this level, mitigating smart money sells from Oct 2023.
My entry for long term holds. Beyond ATH.

SHOPSHOP is a weekly buying demand area, taking into account not breaking the expected target area, area 73

$SHOP will push higher to end 2Q24May 30, 2024 @6:57AM
MONTHLY
- Currently on a downtrend (2D-2D-2D Continuation) #TheStrat
- Finishing off a Stage 3 #TheMoneyFlow
- MACD curling down, RSI curling down at 46
WEEKLY
- MACD beginning to curl up
- Price is b/t the 0.618 & 0.786 monthly fibs (Oct 2023 - Feb 2024)
- Price is slightly under last week's middle price of $58.51 at $58.18 (pre-market)
DAILY
- Price appears to moving upward after touching lower weekly broadening formation (BF) #thestrat
- Gap to be filled above ($64-75) and gap to be filled below ($55-$48)
- MACD and RSI curling up
- On May 28, NYSE:GS maintained NYSE:SHOP as a BUY
DECISION:
HOLDING 2 NYSE:SHOP 65C 19 JUL 24 (AVG: $1.76) (DOWN 30% @ 1.25).

SHOP - Make or Break ?SHOP was doing too good until today.
If this can hold 61 down below, we can see continuation to the upside rally with upside
Upside Target #1 - 75
Upside Target #2 - 80
If this breaks 61/60 , we can see downside gap fill upto 48
Downside Target #1 - 55
Downside Target #2 - 48
Rate cuts should favor these growth names.
All eyes on 61 price level. !!

Shopify (SHOP) Fundamental Analysis and Fair Value Estimate
**1. Revenue and Growth:**
- **Q1 2024 Revenue**: Increased by 23% YoY to $1.9 billion.
- **Adjusted Growth**: 29% growth when adjusting for the sale of logistics businesses.
**2. Profitability:**
- **Gross Profit**: Grew by 33%, reaching $957 million.
- **Gross Margin**: Improved to 51.4% from 47.5% last year.
- **Net Loss**: $273 million or $0.21 per share, compared to a net income of $68 million last year.
**3. Cash Flow:**
- **Free Cash Flow**: $232 million in Q1 2024, up from $86 million last year.
- **Free Cash Flow Margin**: Doubled to 12% YoY.
**4. Balance Sheet:**
- **Cash and Marketable Securities**: $5.2 billion as of March 31, 2024.
- **Net Cash Position**: $4.3 billion after accounting for convertible notes.
**5. Market Position and Competition:**
- **GMV**: Grew by 23% to $60.9 billion in Q1 2024.
- **Merchant Solutions**: Driven by growth in GMV and Shopify Payments.
**6. Valuation Metrics:**
- **Price-to-Sales Ratio**: 14.1x vs. industry average of 16.9x.
- **Fair PS Ratio**: Estimated fair PS ratio is 10.1x, indicating potential overvaluation based on current metrics.
**7. Fair Value Estimates:**
- **Morningstar**: $68 per share.
- **Simply Wall St**: $58.61 per share.
- **Yahoo Finance**: Approximately $49.16 per share.
**Conclusion:**
- **Fair Value Range**: $50 to $68 per share.
- **Considerations**: Strong revenue growth, improving margins, and robust cash flow support the higher valuation, while economic cycle exposure and SMB customer risks may introduce volatility.

$SHOP - Breaking out!NYSE:SHOP Shopify is breaking out from a wedge. Look for a close above the 200DMA for confirmation.
It is also forming a multi-year cup and handle pattern. A breakout above $90 could see much further upside in the stock.

SHOP Waking UpSHOP has been declining for the last ~6 months and now finally waking up. This might be a start to a reversal and then a nice trend. :)

SHOP - LongBreakout, I bought end july calls $70 strike. I think market is still going to hold strong the next few weeks/months.

SHOP at important level#SHOP is at a pivot level were a trendline is meeting with some resistance,
I can see price revisiting highs if we break above this level
Buy SHOP if it closes above 68.5If Shopify (US) closes above $68.5, my trade plan will be buying 75 call @ 2.4 or 80 call @ 1.45 20 September 2024

Shopify (SHOP:NYSE) receives support from Goldman SachsJuly 2024: Shopify's shares took a heavy hit in May after a moderate Q1 earnings report which might have beaten investor consensi, EPS by $0.04 & revenue by $20 mio, yet this was not enough to prevent a large selloff. The share price is currently recovering and is now trading 4,5% higher than it did 12 months ago. This is partly thanks to the analyst from Goldman Sachs, who kept the share rating at "buy" signalling that Goldman Sachs believes Shopify can further accelerate its growth. In general Shopify's rating remains a moderate buy, with analysts giving it a price target of $76.42, a 15.5% upside.
Shopify has been able to increase its market share in e-commerce software platforms and technologies over the last 18 months, now sitting at around 10%, so its large investments in marketing are therefore paying off and bringing in lucrative orders. Shopify is also investing in artificial intelligence (AI) which gives the company a competitive advantage given the large data pool it has access to, and already uses the technology having launched the Shopify Magic suite last year.
The technicals are painting a somewhat mitigated picture, with the RSI sitting in neutral territory around 54 in the daily chart. The stock's price sits above the 50 day MA, and wasn't able to break through the 100 day MA which is flattening out around the 69 mark, which had proved to be a relevant support zone before the drop.
The on balance volume is telling us a similar story, namely that buying and selling pressures have balanced out in the last months and that traders are probably lacking a bit of conviction at the moment. We will most likely have to wait for the Q2 earnings report at the end of the month before seeing a significant move again.
