Spotify - 2h ChartThis is yet another stock that has been hammered down to the ground and I believe it has reached the bottom.
We now see a bull flag pattern that just broke to the upside.
I am super bullish on Spotify! There is huge upside to this stock.
Like & subscribe if you want to see similar analysis and updates. Enjoy!
---
Disclaimer: This is not an investment or financial advice. I'm just sharing an idea for educational purposes.
SPOT trade ideas

$SPOT - Calls > 107SPOT -
- Breakout & retest of trend line
- RSI bullish divergence
- EMA cloud breakout of downtrend
- Watch for calls > 107 or retest of trend line or EMA cloud
- Calls invalidate if drops below trendline or EMA Cloud

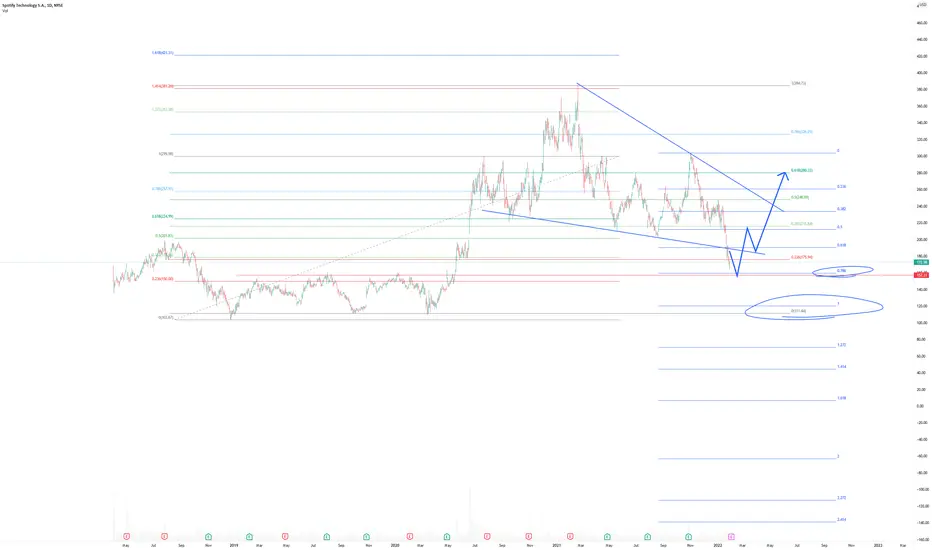
Spotify is very cheap!After having had a bearish stock market, some stocks have fallen to really cheap prices. Spotify is an example of it which has fallen down almost 77% from its' all time high. I know that the downturn might not be over but after having done an ewt analysis, the most probable count is showing a bullish future. This count is based on the fact that we have reached or almost reached a bottom (it still works as long as the price of it remains over 64$ a stock).
TA:
From the 24th of December 2018 to the 22nd of Februari 2021, the stock has moved in 3 waves as a flat* where the b wave was a triangle and the c wave was a large impulse that led to an all time high.
After this, the stock falled down as a zigzag** with a leading diagonal as wave a, another smaller zigzag as wave b and a normal impulse as wave c. This large fall ended with a new all time low just a little bit lower than the previous one.
So what does it tell us? Well if we refer to a normal 3 waves elliott wave pattern, this could be a huge inverted extended flat*** with the all time high marking the end of wave (a) and the all time low marking the end of wave (b). This means we should now (or soon) rally in 5 waves up as wave (c) to an all time high.
The count would only be invalid if the price drops sharply and quickly under at least 64$.
* A flat: is a 3 waves move with the second leg ending a bit lower than the start of the first leg. The first and the second legs can be developed into 3 waves sequences (b wave can also be a triangle) whereas the third leg should develope into a 5 waves sequence.
** Zigzag: A 3 waves move where the first and the third leg are themselves 5 waves impulses separated with the middle leg which is a 3 waves correction.
*** An extended flat: is a 3 waves move with the second leg ending a bit higher than the start of the first leg. The first and the second legs can be developed into 3 waves sequences whereas the third leg should develope into a 5 waves sequence.

Spotify (SPOT) | Inside The Buying ZoneHi,
Criteria:
1. Clean channel projection and couple of short-term rejections from it.
2. Round number $100
3. Liquidity area
4. Fibo Extension
Do your own research and if it matching with my TA you are ready to go.
Regards,
Vaido

Short scalp SPOTBased on its downtrend, regress off resistance and a familiar chart pattern confirmed by my technical indicators, I expect at least half a percent in profits IF SPOT breaches Friday's low of $101.57 during tomorrow's session.

Pending for Support level to be form30th April 2022.
Spotify is at the crucial support area of $100 mark.
Once the candle break and close below $100, we may see further drop in sportify.
If the price is able to be support around $100 +/- 10% deviation, may see small dead cat bounce from here.

Head and ShouldersPrice is at all time low which can create a "no support" situation with plenty of resistance overhead.
SPOT will need to form support all over again. So far, today's low is 96.60
No recommendation.
Just because price is doing poorly, does not mean it can not do worse )o:

SPOT close to our Buy AreaIf you haven`t shorted SPOT after the Joe Rogan controversy at $200:
Then you should know that after active users rose 19% in the quarter from a year earlier to 422 million, SPOT is a buy in my opinion at $100.

Off Radar Stock has Nice Setup for pre-ER CallsEveryone is talking about "big tech" and some of those stocks (like GOOGL) will make a good move post-ER but their option prices are too elevated for a long position. So here we have a nice chart in Spotify, which reports before market open on Wednesday.
Quick chart notes:
> After dropping about $100 (from 365 to 265) and consolidating, price went down another $100 (from 210 to 110)
> White line shows 110 support on weekly chart
> Yellow ovals show bullish divergence has already completed
> Looking at past stochastic dips, I like that %K is so low while %D has come up above 20
I like the risk to reward here, so I bought 20May 150 strike. If stock goes to 120 post-ER and IV drops by 20 I will have a small loss. Price ideally needs to move over 130 before this week ends for me to hold longer, but this plan may change after I see IV change and actual price action.
*** of course, even though the chart shows that 110 is a low-risk area to go long, I am using very little capital because if the stock drops then I will lose most premium.

Spot Not much historical price action below 109. In at 109.75 and 110. Long swing. Really the chart shows it all. Lose 109 GTfO. Hold it and we gone

Spotify (NYSE: $SPOT) Could Double Before End Of 2022! 👌Spotify Technology S.A., together with its subsidiaries, provides audio streaming services worldwide. It operates through Premium and Ad-Supported segments. The Premium segment offers unlimited online and offline streaming access to its catalog of music and podcasts without commercial breaks to its subscribers. The Ad-Supported segment provides on-demand online access to its catalog of music and unlimited online access to the catalog of podcasts to its subscribers on their computers, tablets, and compatible mobile devices. The company also offers sales, marketing, contract research and development, and customer support services. As of December 31, 2021, its platform included 406 million monthly active users and 180 million premium subscribers in 184 countries and territories. The company was incorporated in 2006 and is based in Luxembourg, Luxembourg.

SPOTIFY (Y22.P1.E1).Has a deep correction finishedHi All,
I saw someone tweet that its time to buy Spotify and something about Joe Rogan.
When people sell off in such a way, its usually to fear.
I think this is a typical selloff after its reached its target and the cycle it to start again, reaccumulation.
The fib and the previous resistance level makes sense to enter and also can be a bear trap as a descending wedge could play out.
I will not mention when to buy but 157 looks like a good level. One might wait to place 2 levels of orders... at 157 and the other, after you see a bounce and a regain of the level as per my price path on the chart.
Also note how RSI on the daily is way down below oversold conditions.
All the best,
S.SAri
SPOTIFY - Monthly Demand ContactedNYSE:SPOT
SPOT has contacted Monthly Demand and is in line with the Monthly Demand that the S&P 500 has contacted.
There are several stocks that are currently aligned with the Monthly Demand of the S&P 500 ** See my profile for more stock scenarios**
SPOT has the potential to rocket with institution demand coming into play. This trade has the potential to reach new highs in the long term.
As we reach PEAK FEAR in the markets, we are liking to have reached a bottom on the S&P 500

Spotify Setup Going into MarchSPOT is in an interesting position and testing a pretty important area of support when compared to it's price action in 2019. The recent selling pressure across the tech sector briefly pushed this stock back into the prior horizontal price channel (accumulation zone of 2019), and is trying to test this support zone between $148-$152 as we go into March.
Bullish Scenario:
SPOT would have to break above the 50 and 100 MA going into March, and hold levels above the midline of it's current descending channel in order to build bullish momentum back up to $200. Considering the volatile price bounce across the major indexes over the last two days, I think it is possible that the 100MA is tested (~$160), but going into March I expect that bullish positions will be hampered by the anticipation of interest rate hikes from the Fed.
Bearish Scenario:
Assuming that SPOT successfully tests the 100 MA over the next two weeks but is unable to hold above those levels, I see a very plausible case where price begins to fall back into 2019's horizontal channel as the markets begin to react to the Fed's expected interest rate decision. I'm considering this to be the more plausible of the two scenarios.

Spotify - JRE Liking market sentiment down here in potential Monthly demand zone.
looking in and around zone will monitor closely, added to watchlist revisit weekly..
we are closer potentially to a buyers position (only if price becomes clear and PA is present ) as to the sell side our important r/r ratio is more worse..
let chart tell us which direction to trade not other way round.
Perma.

IPO price supportNext earnings will be better than anticipated due to the Joe Rogan/medias pessimism.
Based on my observation user numbers should be up significantly from the controversy rather than down.
Company has been making aggressive investments for growth as priority rather than focusing on bottom line for now.
Price/Sales = 2.86
Price is back to around IPO price, a good base for a bottom.
Potential Hidden bull div on the monthly.
TP1 239
TP2 314
TP3 464

SPOT channel breakNice push to break the flag today.
If we continue higher tomorrow, there is room to retest area of sell off (ERs)


SPOT 1D wolfe wave bullishA Wolfe Wave is a chart pattern composed of five wave patterns in price that imply an underlying equilibrium price. Investors who use this system time their trades based upon the resistance and support lines indicated by the pattern.

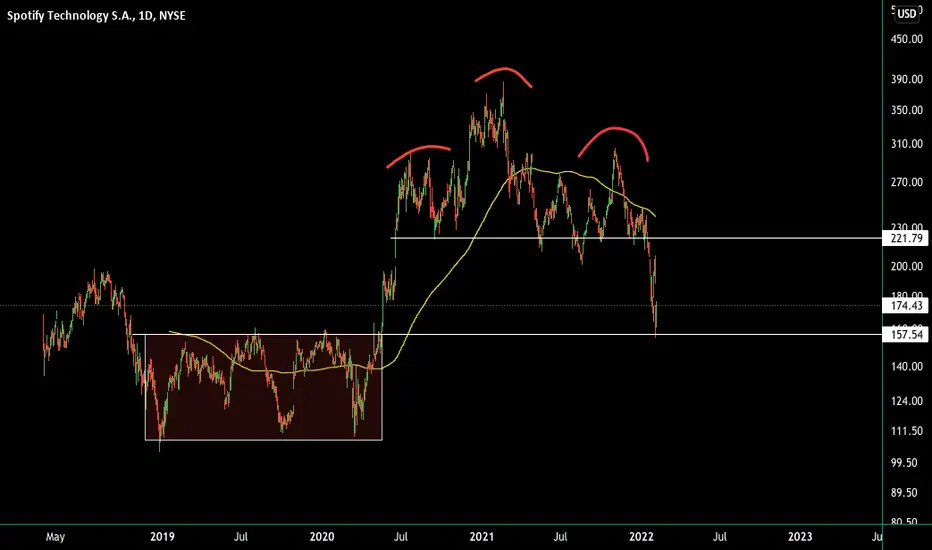
News is just about narratives. Head and shoulders reversalNews is just about narratives. I observed this Head and shoulders reversal on $SPOT back in august 2021. My exact words were " RIP #SPOTIFY and 155 is logical target". We just hit it. Cheers! Shoutout to Rogan Too
Here is my chart from august 2021:
Spotify Earnings OutperformedSpotify Earnings outperformed despite Joe Rogan negative media coverage.
Potential buy IF breakout of resistance level ~$190, pessimistic TP level ~$250 for approx 30% upside

Good area to buyJust wait to buy so we fill the gap easy 20% perf
thank me later, most of my analysis are correct

SPOT Spotify Price Target after H&S and Joe Rogan controversyToday you will probably have the chance to buy SPOT at the price of its IPO in 2018.
But the price target, in my opinion, it`s even lower.
Looking at the Head and Shoulders Bearish chart pattern combined with the Joe Rogan controversy that has exposed Spotify’s weaknesses, i would say $126 per share is my buy area.
Looking forward to read your opinion about it.
