TSLZ to take advantage of TSLA dip to $280TSLA has had a nice run for about 2 months, but gravity always prevails and profit takers will push the price to about $280-300 range. You can use TSLZ to take advantage of this position IMHO!
Best of luck and always do your own due diligence!
TSLA trade ideas

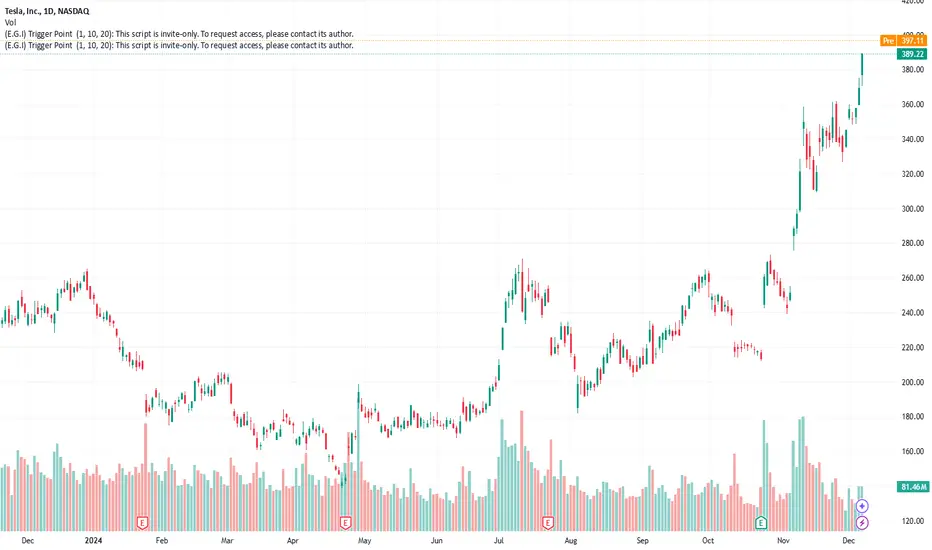
TSLA LongTSLA currently priced @ 389.79 ... with a target of 400 and an extended target of 410-420
TSLA chart currently shows a breakout above the upper trend-line...
- the move to the upside will target 400 as a psych level with heavy liquidity being at 410 and 420 due to current open interest levels on call options.
- a move back to the downside will be considered a buy the dip opportunity or re-test of Friday and todays price action
- the opening price on Friday's candle and the low of today's candle will serve as support levels at 377.42 and 378 respectively
- holding 390 and breaking above the slight resistance at 397 opens up 400 and higher (This will rage!!)
Indicators like MACD & RSI are trending upwards and looking bullish
9-day EMA and 50-day EMA are both trending upwards and the 9-day EMA is trending upward and away from the 50 which is bullish.
Call options that are interesting:
-TSLA 400 Call 12/13
-Volume: 144,881 (contracts traded)
-Open Interest: 37,205 (open positions and liquidity)
-Volume to Open Interest ratio ~ 3:1
-Open Interest for tomorrow has to open up around 75k plus. Why? As an investor or trader, you are looking to see people hold their investment position as a sign of trend confirmation and continuation
-TSLA 410 Call 12/13
-Volume: 43,965
-Open Interest: 4,923
-Volume to Open Interest ratio ~ 9:1
-Open Interest for tomorrow has to open up around 25k
-TSLA 420 Call 12/13
-Volume: 57,432
-Open Interest: 37,598
-Volume to Open Interest ratio ~ 1.5:1
-Open Interest has to open up around - 45k

Tesla(TSLA) 4h technical analysis- Support Resistance Trend LineIndicator settings and test on Tesla (TSLA) 4h chart
Indicator: Support Resistance Trend Line (SRTL)
Indicator link:
Chart analysis and drawing important areas is a time-consuming task that requires constant review and modification and updating to match the current market conditions and the selected timeframe, which will inevitably be accompanied by inadvertent mistakes.
This indicator automatically draws and updates the important areas of technical analysis (Support-Resistance, Demand-Supply, Trend lines, ). So you do not need to spend time analyzing the chart and updating it, and all these items will be drawn for you with high accuracy, and you can easily move quickly through all the symbols and timeframes you want, and the necessary and up-to-date information will always be at your disposal, and all you need to do is focus on managing your capital based on your personal strategy.
Features:
Drawing current trend lines and the last broken trend lines
Drawing support and resistance (supply and demand) areas along with showing the strength of the area compared to other areas
Drawing price compression areas
Drawing range areas
Drawing pivot moving average area
Sending notifications for important events such as the formation of a new trend line, breaking a trend line, breaking a support or resistance area, exiting accumulation areas, entering or exiting the pivot moving average area.
#indicators #trade #technicalanalysis #support_resistance #trendline #demand_suply

Trading Plan for TSLA: December 10, 2024Key Levels to Watch
1. Resistance Levels:
* $390 (2nd Call Wall): A significant gamma-based resistance zone where market-makers may adjust their hedging activity, potentially capping upside momentum.
* $400 (Next Key Level): Breaking above $390 with strong volume could lead to a rally toward $400, supported by bullish momentum.
2. Support Levels:
* $380 (Gamma Support): Critical support level identified by the GEX indicator. A bounce from here would align with institutional activity.
* $370: If $380 breaks, $370 could be the next target, acting as the secondary gamma-supported level.
Scenarios and Trade Ideas
1. Bullish Scenario:
* Look for a breakout above $390, confirmed by increased volume and bullish MACD/RSI signals.
* Entry Point: $391 with a target of $400 and $410.
* Stop-Loss: Below $389 to minimize risk.
* Rationale: Gamma unwind above $390 could trigger additional upside momentum, supported by the trendline.
2. Bearish Scenario:
* Watch for a breakdown below $380, accompanied by high selling volume and bearish indicators.
* Entry Point: $379 with a target of $370.
* Stop-Loss: Above $382.
* Rationale: Breaking gamma support at $380 could lead to a quick drop toward $370, reflecting market-maker adjustments.
Intraday Plan
1. Morning:
* Monitor the open for directionality. Look for any gap-up or gap-down behavior near $390 or $380 to confirm early momentum.
* Bullish: If price holds above $390 with rising volume, consider a long trade targeting $400.
* Bearish: If price fails to hold $390, short to $380 with tight stops.
2. Midday Consolidation:
* Expect price to hover near key gamma levels ($390 or $380). Scalping opportunities may arise within these zones.
* Use MACD and RSI to confirm entries during consolidation phases.
3. Afternoon Directional Move:
* Watch for potential breakouts or breakdowns from $390 or $380 as traders position for the next session.
* Align trades with GEX indicator levels for precision.
Key Indicators
1. Gamma Exposure (GEX):
* Use $390 and $380 to gauge where institutional hedging may cause reversals or consolidations.
* Anticipate volatility near these levels.
2. Trendlines:
* Confirm bullish or bearish bias based on the price's respect or breach of trendlines.
3. MACD/RSI:
* Use MACD crossovers and RSI readings to validate momentum shifts around gamma zones.
Summary
For tomorrow's trading session, focus on price action near $390 (GEX Gamma key resistance) and $380 (GEX Gamma key support). Leverage gamma-based levels for precision entries and exits, and align with trendline and indicator confirmations for a well-rounded trading strategy. Keep risk management at the forefront and be prepared for high volatility at gamma pivot points.
Disclaimer
This analysis is for informational purposes only and not financial advice. Please consult your financial advisor or conduct your own research before trading.

An Update For MY Followers Hey Everyone
Wanted to quickly update everyone as I have been MIA the last two weeks working on a really cool project to create even more value for everyone. I will be back in action tomorrow, so if you have any assets you want me to analyze let me know and I will do that for you. Secondly if you are wanting to increase your wellness and your trading send me a DM.
Hope everyone has a awesome day and I will see you tomorrow
Kris / Mindbloome Exchange
Trade What You See

Tesla - Ending 2024 With A Parabolic Rally!Tesla ( NASDAQ:TSLA ) is clearly not done for 2024:
Click chart above to see the detailed analysis👆🏻
Despite (or maybe even because of) the strong rally during November of 2024, Tesla is clearly not done with its bullish plans yet. Market structure, cycles and also price action are all pointing to a stronger move higher and we will see at least a retest of the previous all time highs.
Levels to watch: $420
Keep your long term vision,
Philip (BasicTrading)

TSLA CRACK!TSLA cracking higher with a gap up breaking out of a wedge after several attempts this year,
Personally, I don't like wedges since they have a tendency to crack one way and reverse the other.
But having the entire US gov't giving you a free pass to do whatever you want without fear of being prosecuted for illegal activity and getting even more free money from the taxpayers. It might be different this time.
I can only tell you what the charts say.

TESLA $TSLA | TESLA RALLY TO 400?! (ASCENDING TRIANGLE) Dec05'24TESLA NASDAQ:TSLA | TESLA RALLY TO 400?! (ASCENDING TRIANGLE) Dec05'24
NASDAQ:TSLA BUY/LONG ZONE (GREEN): $357.50 - $400.00
NASDAQ:TSLA DO NOT TRADE/DNT ZONE (WHITE): $331.00 - $357.50
NASDAQ:TSLA SELL/SHORT ZONE (RED): $270.00 - $331.00
NASDAQ:TSLA Trends:
NASDAQ:TSLA Weekly Trend: Bullish
NASDAQ:TSLA Daily Trend: Bullish
NASDAQ:TSLA 4H Trend: Bullish
NASDAQ:TSLA 1H Trend: Bullish
NASDAQ:TSLA is hanging on to the strong bullish rally that first began after the most recent earnings report (Oct23), followed by the Trump rally after the presidential election. NASDAQ:TSLA has been building an ascending triangle at the 360 price level, and a popular belief is that a break above this level will be the start of the push to the 400 price level. Here is what I'm personally looking at for possible NASDAQ:TSLA trade opportunities, potential for upside and downside, and how I'm viewing price structure and technicals with the help of some of my personal indicators!
This is what I would personally look at before entering trades, everything is subject to change on a daily basis and as I analyze different timeframes and ideas.
ENTERTAINMENT PURPOSES ONLY, NOT FINANCIAL ADVICE!
trendanalysis, trendtrading, priceaction, priceactiontrading, technicalindicators, supportandresistance, tesla, NASDAQ:TSLA , tsla, teslaearnings, teslatrend, teslamomentum, teslalong, teslashort, teslatrade, teslaidea, tesladirection, teslaearningsreport, teslareport, teslarelease, teslamodel2, teslamodel3, teslamodel3performance, teslaconference, teslanews, teslacall, teslaput, teslaoptions, teslapatterns, teslachartpatterns, teslasupport, tslatrend, tslamomentum, tslatrade, tslalong, tslashort, teslabuy, teslasell, elonmusk, elon, nasdaq, ndx, ndq, qqq, us100, nas, tech, techstocks, ev, evstocks, teslaearnings, robotaxi, robotaxi event, tesla1010event, 10/10event, teslarobotaxi, teslarobocap, teslarobovan, teslaearningsreport, teslarallyto400, teslapricetarget, teslaascendingtrianglepattern, patterntrading, ascendingtriangle,

Telsa, Bullish Opportunity: Wait for the Pullback first.TESLA / 1D
Hello Traders, welcome back to another market breakdown.
The market is showing strong bullish momentum, breaking through key resistance levels and signaling a potential continuation to the upside. However, instead of jumping in at current levels, I recommend waiting for a pullback into the breakout zone for a more strategic entry.
If the pullback holds and buying confirms, the next leg higher could target:
1- First Resistance: Immediate levels formed during prior consolidation.
2- All-time high
3- The one standard deviation target is shown in the chart.
Why Wait?
Entering after a pullback ensures you're trading with confirmation and reduces the risk of chasing the market. This approach not only minimizes drawdowns but also increases the probability of catching the trend at a stronger position.
Stay disciplined, wait for the market to come to you, and trade with confidence!
Trade safely,
Trader Leo.

TSLA (1-Hour Timeframe) Analysis. Dec. 9Market Overview
* TSLA has been trading in a clear uptrend, with a strong push to retest the resistance zone at $399.00.
* A rising wedge pattern is forming, which could signal a potential pullback if momentum slows.
* Volume is declining on the latest push upwards, suggesting reduced buyer enthusiasm near resistance.
Key Levels
1. Resistance:
* $399.00: Strong psychological and technical resistance. A breakout above could trigger a rally toward $410.00.
* $401.97: Intraday resistance based on recent highs.
2. Support:
* $379.00: Immediate support and previous consolidation area.
* $370.78: Critical support zone; a break below could signal a deeper correction.
* $326.59: Major support and previous demand zone.
Technical Indicators
* 9 EMA: Price is riding the EMA upward, confirming short-term bullish momentum.
* MACD: Histogram is showing weakening momentum as the MACD line flattens, indicating possible consolidation or reversal.
* Volume: Declining as price approaches resistance, a potential bearish divergence.
Scenarios and Trading Plan
Bullish Scenario:
* If TSLA breaks and holds above $399.00, it may head toward $410.00.
* Entry: $399.50 on breakout with volume confirmation.
* Stop Loss: $396.00.
* Take Profit: $405.00 and $410.00.
Bearish Scenario:
* If TSLA fails to break $399.00 and closes below $379.00, a pullback toward $370.78 or lower could occur.
* Entry: Short at $378.50.
* Stop Loss: $382.50.
* Take Profit: $370.00 and $365.00.
Risk Management Checklist
1. Watch for high-volume confirmation before entering any breakout trades.
2. Respect stop losses to manage risk.
3. Monitor MACD and volume trends for divergence.
Thoughts
* TSLA's current trend is bullish, but the weakening momentum suggests a short-term pullback could occur before another leg up.
* Traders should wait for confirmation of direction before committing to a position.

Tesla At $400; More Gains After PullbackHey traders, hope everyone is doing well.
Today, I will looking at Tesla stock, which as you know has impressive gains for the last few weeks, due to speculation surrounding Trump's US presidential election win and connections with Elon Musk. This has fueled expectations of easier regulations for self-driving Tesla cars.
But loking at the structure, the current rally from 340 appears to be coming out of a triangle and has now reached the 400 area. Its the key swing high from 2022 and 2021, suggesting the potential for a pullback in the coming weeks.
So I think its better to wait for the next wave (4) retracement rather than chasing the market at these levels. If a wave four pullback occurs, support could be found between 311 and 350, especially if the decline unfolds in three waves.
GH

Maximize Your Gains: TSLA Set for Major Price Movements Next WeeRecent Performance: Tesla has recently showcased robust market activity,
achieving approximately 5.34% gains and contributing about 11% to the NASDAQ
index over the past week. This indicates strong investor interest and
sustained bullish momentum. The upcoming quarter is expected to be a key
period for Tesla, where market expectations around growth and sustainable
practices will come under scrutiny.
- Key Insights: Analysts maintain a positive outlook on Tesla, with expectations
driven by advancements in artificial intelligence and robotics. The
consensus is that Tesla’s innovative business model positions it favorably
for growth beyond electric vehicles. Anticipated regulatory changes and the
rollout of robotic taxi services by 2025 are additional factors likely to
enhance Tesla's market value.
- Expert Analysis: Market sentiment around TSLA is overwhelmingly bullish, with
analysts projecting high growth potential as Tesla diversifies into AI and
renewable energy. Anticipated delivery figures for Q3 are set to be a
significant catalyst, with many expecting an increase not seen since 2022.
Upcoming events, including Robo Taxi day, are expected to showcase Tesla’s
advancements in autonomous technology, further bolstering investor
confidence.
- Price Targets: Based on professional traders' insights, the next week price
targets for TSLA are as follows:
- Next week targets: T1 at $410, T2 at $425
- Stop levels: S1 at $365, S2 at $360
- News Impact: Key upcoming events that could significantly influence TSLA's
stock performance include the announcement of the Q3 delivery numbers on
October 2nd, paired with Robo Taxi day on October 10th. Positive delivery
numbers could enhance investor optimism, while advancements in self-driving
technology are likely to draw considerable attention, potentially pushing
TSLA to new highs amid prevalent bullish sentiment.
TSLA on the go...Hello TradingView Family / Fellow Traders. This is Richard, also known as theSignalyst.
📈 After rejecting the $200 round number zone and breaking above the red channel, TSLA's momentum shifted from bearish to bullish.
Currently, TSLA is in a correction phase and approaching the green demand zone and round number $300.
📚 As per my trading style:
As #TESLA approaches the $300 zone, I will be looking for bullish reversal setups (like a double bottom pattern, trendline break , and so on...)
📚 Always follow your trading plan regarding entry, risk management, and trade management.
Good luck!
All Strategies Are Good; If Managed Properly!
~Rich

Pulse of an Asset via Fibonacci: TSLA at ATH Impulse Redux"Impulse" is a surge that creates "Ripples", like a pebble into water.
"Impulse Redux" is returning of wave to the original source of energy.
"Impulse Core" is the zone of maximum energy, in the Golden Pocket.
Are the sellers still there? Enough to absorb the buying power?
Reaction at Impulse is worth observing closely to gauge energy.
Rejection is expected on at least first approach if not several.
Part of my ongoing series to collect examples of my Methodology: (click links below)
Chapter 1: Introduction and numerous Examples
Chapter 2: Detailed views and Wave Analysis
Chapter 3: The Dreaded 9.618: Murderer of Moves
Chapter 4: Impulse Redux: Return to Birth place <= Current Example
Chapter 5: Golden Growth: Parabolic Expansions
Chapter 6: Give me a ping Vasili: one Ping only
.
.
Ordered Chaos
every Wave is born from Impulse,
like a Pebble into Water.
every Pebble bears its own Ripples,
gilded of Ratio Golden.
every Ripple behaves as its forerunner,
setting the Pulse.
each line Gains its Gravity.
each line Tried and Tested.
each line Poised to Reflect.
every Asset Class behaves this way.
every Time Frame displays its ripples.
every Brain Chord rings these rhythms.
He who Understands will be Humble.
He who Grasps will observe the Order.
He who Ignores will behold only Chaos.
Ordered Chaos
.
.
.
want to Learn a little More?
can you Spend a few Moments?
click the Links under Related.

TESLA: Bearish Continuation & Short Signal
TESLA
- Classic bearish formation
- Our team expects fall
SUGGESTED TRADE:
Swing Trade
Sell TESLA
Entry Level - 389.41
Sl - 412.70
Tp - 333.03
Our Risk - 1%
Start protection of your profits from lower levels
❤️ Please, support our work with like & comment! ❤️

Tesla update Hi traders this is tesla update the one I've been. Begging everyone to buy, congratulations to those who took advantages of it,I have 3 more stocks that are cheap in my stock list however I won't share them in public, people's seems to not appreciate it,soo I will share results,next time don't think twice to follow my ideas thank you.

Tesla to $1500 or $2000? Why not.A couple of different ways of looking at this. The circle, I don't know what the idea is behind it, but I've seen it work before. I've seen others use it too.
Secondly, there is a measured movement, if you take the base, the box would be the target. With 50% and then full 100% target.

TSLA Santa Clause Rally IdeaHere’s my idea for TSLA's "Santa Claus Rally" over the next two to three weeks as a swing trade:
I anticipate the price will rise and hit $425, followed by a sharp drop to $325 as part of a liquidity sweep. After that, Santa will load up his sleigh, and the price will rally to $500! 🎅

Topic: Time Factor Ideation - Theory for my subscribers
I was thinking this is not the right platform for these ideas but I had to correct myself & post as soon as possible.
Let’s start!
There’s a fascinating correlation between time and investing and time and trading.
There’s actually a natural correlation of time in all cycles. Market Cycles / Economic cycles / Adoption Cycles, Life cycle.
This gnawing prevalence of time and its impact has been explored by a ton of great traders and investors & a result of some of these investigations had lead to us developing a ton of tools: Gan Fans, Fibonacci etc.
The issue with short term trading is that we missed out the greatest tool in investing - time. This is not a knock or promotion of one trading style over another just ideation of thoughts.
Money can be made everyday in the stock market full stop. It doesn’t mean you should be in the stock market everyday. To add it would be wise to listen to the advice of great traders - you should take time a way from the markets. Or surely we will suffer the same faith of those before us.
Continuing previous points. -
We can be at the right place, with the right tools but at the wrong time. You might lose 20 trades in a row due to being right but repeatedly punished for trying to time a move.
You might not be wrong - you are also not right.
If only you kept your first trade open with a clear invalidation level. How many times have you walked away from a good ticker / trade due to frustration and then see it work out?
I’ll go first all the time!
An issue of traders then might be the need to (trade) — for better or worse. Maybe we should change our title to Wealth Obtainer. I kid!
You might get the raise you were looking for but at the wrong time & now you’ve missed out on the opportunity to buy the starter home. Now you are buying overvalued homes in high inflation environments with high interest rates / insurance.
You might be the largest sheep farmer - in a time period where there are no use for sheep and wool.
If only I bought Nvidia while I was 3 year old.

$TSLA just DOUBLED THESE LEAPS given 2 weeks agoStep by step I gave yall this FIBONACCI MASTERPIECE
Drop a like for more MY TARGET remains 400!
If you want the next setup show me some love!

From zero to legendary in less than 4 years (check my profile)
It took me less than 4 years to go from unprofitable to very profitable. Im not saying im the best trader in the world, just one of them. You can see the progression from noob to legend in my profile. I was so bad just 5 years ago. I did these percentage gains in spot stock market btw. I do not use leverage or any margin. This is all spot market. I know it says allocated but these are realized gains, I hold no investments. I am a day trader down to the absolute core of my strategy. Thats why I feel im one of the best day traders in the world because I did this without leverage or margin. I am 100% self taught, I have no mentor. You be the judge. I just wanna trade.
🔆🔆🔆🔆🔆

TESLA Resistance Ahead! Sell!
Hello,Traders!
TESLA keeps going up
But the stock will soon
Hit a horizontal resistance
Soon at around 414$ from
Where we will be expecting
A local bearish correction
Sell!
Comment and subscribe to help us grow!
Check out other forecasts below too!

tesla's next mid term move possible rejection at ATH to $300 ish range and then parabolic move to the new ATH $600+
