$200 price target on TESLA IF (BIGO IF) recession hits NASDAQ:TSLA
I am telling you right now, the mf back there is not real!
TSLA trade ideas

TSLA 4H chart analysisPrice: 275.59, down 3.28%.
Trend: Bearish (red TrendShift), confirmed by MACD (bullish momentum fading).
Support: 222.79 (strong, multiple tests).
Resistance: 274.68 (recent high, failed breakout).
Volume: 11.2M, declining on upticks, suggesting weak buying pressure.
Indicators: MACD bearish crossover, TrendConfirm bearish.
Outlook: Likely to test support at 222.79; break below could target 200.00. Resistance at 274.68 caps upside.
Price Action with S/R and MACD

TSLA Bull or bearish NASDAQ:TSLA 28-04.2025
TSLA is looking suspicious, but the market is still bearish until proven otherwise other words until price moves back and above the fair value gap in the S&P 500 and re establishes up trend. Price can add on to the confirmation of the newly broken resistance and then rebound for further confirmation and then add on upward. Or this will turn out to be a more likely false break out and then bounce back into then consolidation chamber.

Tesla trading planTesla is also in my list and is the most hit during trading War n most heated were by even cars n stations were burning down by that it lead musk to lost more than 130 billion dollars in his networthy but it looks promising for further growth as you can see I trust my work and is always put smile in my face n growth,try by all means to position yourselfs in one of the stocks I've sent and note that we don't control the market,no matter clear structure can be we trade responsibly n risk very smart all the best

Quantum's TSLA Trading Guide 4/13/25Sentiment: Neutral. EV and AI optimism persists, but tariff risks and high valuation concern traders. Chatter split—bulls eye robotaxi, bears see pullback.
Outlook: Neutral, slightly bearish. Options pin $250, with $240 puts active. ICT/SMT eyes $245-$250 buys to $260 if $245 holds. Bearish below $245 risks $240.
Influential News:
Federal Reserve: Two 2025 cuts support growth stocks, positive for $TSLA.
Earnings: Q1 due late April; no update today.
Chatter: Debates tariff impact vs. AI/EV growth.
Mergers and Acquisitions: None; focus on internal projects.
Other: Tariff volatility hit NASDAQ:TSLA ; stock swung (April 3-9).
Indicators:
Weekly:
RSI: ~50 (neutral).
Stochastic: ~45 (neutral).
MFI: ~40 (neutral).
SMAs: 10-day ~$255 (below, bearish), 20-day ~$260 (below, bearish).
Interpretation: Neutral, bearish SMAs signal weakness.
Daily:
RSI: ~48 (neutral).
Stochastic: ~50 (neutral).
MFI: ~45 (neutral).
SMAs: 10-day ~$255 (below, bearish), 20-day ~$260 (below, bearish).
Interpretation: Neutral, bearish SMAs suggest pullback.
Hourly:
RSI: ~45 (neutral).
Stochastic: ~55 (neutral).
MFI: ~50 (neutral).
SMAs: 10-day ~$255 (below, bearish), 20-day ~$260 (below, bearish).
Interpretation: Neutral, stabilizing.
Price Context: $252.31, 1M: +1%, 1Y: +38%. Range $240-$270, testing $250 support.
Options Positioning (May 2025):
Volume:
Calls: $260 (15,000, 60% ask), $270 (12,000, 55% ask). Mild bullish bets.
Puts: $240 (10,000, 70% bid), $245 (8,000, 65% bid). Put selling supports $245.
Open Interest:
Calls: $260 (40,000, +7,000), $270 (30,000, +5,000). Bullish interest.
Puts: $240 (25,000, flat), $245 (28,000, +4,000). Hedging. Put-call ~1.0.
IV Skew:
Calls: $260 (40%), $270 (42%, up 3%). $270 IV rise shows upside hope.
Puts: $240 (35%, down 2%), $245 (36%). Falling $240 IV supports floor.
Probability: 60% $240-$270, 20% <$240.
Karsan’s Interpretation:
Vanna: Neutral (~300k shares/1% IV). IV drop could pressure $250.
Charm: Neutral (~150k shares/day). Pins $250.
GEX: +50,000. Stabilizes range.
DEX: +7M shares, neutral.
Karsan view: GEX holds $240-$270; tariff news key.
ICT/SMT Analysis:
Weekly: Neutral, $240 support, $270 resistance. No $TSLA/ NYSE:NIO divergence.
Daily: Bullish at $250 FVG, targets $260. Bearish < $245.
1-Hour: Bullish >$250, $260 target. MSS at $245.
10-Minute: OTE ($249-$251, $250) for buys, NY AM.
Trade Idea:
Bullish: 50%. ICT/SMT buys $245-$250 to $260. Options show $260 calls. Fed cuts aid.
Neutral: 35%. RSI (~50), SMAs (bearish), $240-$270 range.
Bearish: 15%. Below $240 possible with tariffs. $240 put volume grows.


TESLA Stock Chart Fibonacci Analysis 042525Trading Idea
1) Find a FIBO slingshot
2) Check FIBO 61.80% level
3) Entry Point > 260/61.80%
Chart time frame: B
A) 15 min(1W-3M)
B) 1 hr(3M-6M)
C) 4 hr(6M-1year)
D) 1 day(1-3years)
Stock progress: A
A) Keep rising over 61.80% resistance
B) 61.80% resistance
C) 61.80% support
D) Hit the bottom
E) Hit the top
Stocks rise as they rise from support and fall from resistance. Our goal is to find a low support point and enter. It can be referred to as buying at the pullback point. The pullback point can be found with a Fibonacci extension of 61.80%. This is a step to find entry level. 1) Find a triangle (Fibonacci Speed Fan Line) that connects the high (resistance) and low (support) points of the stock in progress, where it is continuously expressed as a Slingshot, 2) and create a Fibonacci extension level for the first rising wave from the start point of slingshot pattern.
When the current price goes over 61.80% level , that can be a good entry point, especially if the SMA 100 and 200 curves are gathered together at 61.80%, it is a very good entry point.
As a great help, tradingview provides these Fibonacci speed fan lines and extension levels with ease. So if you use the Fibonacci fan line, the extension level, and the SMA 100/200 curve well, you can find an entry point for the stock market. At least you have to enter at this low point to avoid trading failure, and if you are skilled at entering this low point, with fibonacci6180 technique, your reading skill to chart will be greatly improved.
If you want to do day trading, please set the time frame to 5 minutes or 15 minutes, and you will see many of the low point of rising stocks.
If want to prefer long term range trading, you can set the time frame to 1 hr or 1 day.

Understanding Market Types in Drummond GeometryThe 5 Market Types:
1️⃣ Congestion Entrance – The market slows down after a trend and starts moving sideways.
2️⃣ Congestion Action – Prices oscillate within a range, with no clear trend direction.
3️⃣ Congestion Exit – The market breaks out of congestion, starting a new trend.
4️⃣ Trending – Prices move in a clear direction, either up or down.
5️⃣ Trend Reversal – A trend suddenly shifts in the opposite direction.
🔥 The 3 Close Rule for Trends
A trend is defined when the PL Dot (a short-term moving average) remains on one side of the close for three consecutive bars. If this happens, the market is in a trend until congestion begins.
📌 Congestion Entrance: The First Sign of a Trend Change
A congestion entrance occurs when the PL Dot switches sides relative to the close. This signals that the market is entering a sideways phase. Until the next trend establishes itself, the market will stay in congestion.
🔹 How to spot it?
If a trend slows down and price closes on the opposite side of the PL Dot, it is the first bar of congestion.
The market remains in congestion until a new 3-close trend forms.
📌 Congestion Action: The Market Moves Sideways
During congestion action, prices move back and forth between support and resistance without breaking out. The PL Dot is often flat, and traders look for signals of continuation or breakout.
🔹 How to trade it?
Identify strong support & resistance levels.
Trade within the range (buy low, sell high).
Watch for signs of congestion exit (breakout).
📌 Congestion Exit: The Breakout Phase 🚀
A congestion exit happens when the market leaves congestion and starts a new trend. This is one of the most profitable trading opportunities.
🔹 How to spot it?
Price breaks above resistance or below support.
The PL Dot starts moving in a clear direction.
The market closes outside the congestion range.
🔹 How to trade it?
Enter after a confirmed breakout.
Use PL Dot & support levels to manage risk.
Pyramid your position if the trend continues strongly.
📌 Trending Market: The Sweet Spot for Traders 📈
Once the market has exited congestion, it enters a trend. This is when traders can ride momentum and maximize gains.
🔹 How to trade a trend?
Enter early & stay in as long as PL Dot supports the move.
Pyramid your position for bigger profits.
Monitor resistance & support to determine exits.
📌 Trend Reversal: Spotting the Shift in Direction 🔄
A trend reversal happens when the market suddenly changes direction. This is confirmed when three consecutive closes appear on the opposite side of the PL Dot.
🔹 How to spot it?
PL Dot pulls back into the range.
Resistance/support levels start breaking.
A major higher timeframe resistance level is hit.
🔹 How to trade it?
Exit your position before the reversal is confirmed.
Look for a new congestion entrance or a trend change signal.
If reversal is confirmed, trade in the new trend direction.
🎯 Key Takeaways for Drummond Traders:
✔️ Know the 5 market types. Each phase requires a different strategy.
✔️ The PL Dot is key. It signals trend strength and potential reversals.
✔️ Congestion action = patience. Wait for clear breakouts before entering trades.
✔️ Ride the trend. The best profits come from early identification of trends.
✔️ Monitor resistance & support. This helps determine potential reversals.
🚀 Master these market types, and you’ll be able to trade with more confidence, better timing, and higher accuracy.
📌 Do you use Drummond Geometry in your trading? Drop a comment below! 👇

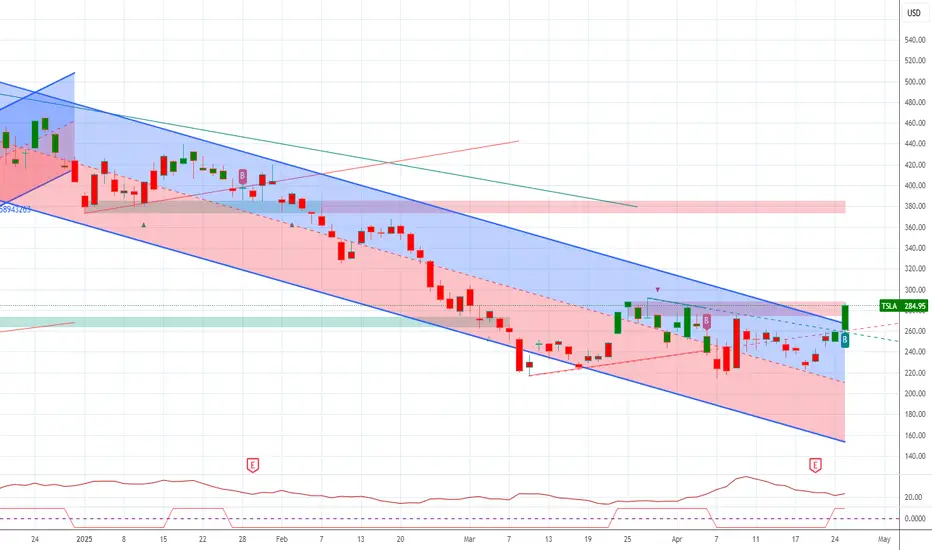
TSLA: An alternate (bullish) viewMy primary count on TSLA is still bearish. On my primary view, this move is supposed to be wave Y of Primary wave 4. If that is still in progress, then the current consolidation is only wave b of Y and TSLA should fall back more towards the lows of $100 area. But we cannot ignore the other side altogether. In this alternative view, Primary wave 4 was complete back in Jan 2023 and since then TSLA has been making a gigantic ending diagonal wave5 to complete the cycle wave 3. If that is the case, then we should see some kind of a bottoming pattern to complete wave Y intermediate wave 4 and resume wave 5 upward.
So, how can we prepare for whichever direction things play out? If price to follow the bearish count, price would break below the $214 low and continue on a strong 5 waves C down to complete the correction. If price to take the bullish route, should not create any lower low from $222.79 and ultimately break above $291.85.

TSLA GEX & Price Action Outlook – April 23🧠 GEX Sentiment (Options Flow Insight):
TSLA is showing bullish options sentiment, with the HVL (high-volume level) pinned at 240, acting as short-term support. GEX shows strong call resistance at 260–265, with the highest positive NET GEX wall just below that zone. We also have significant put walls stacked down at 220 and 225, forming a clear risk floor.
* GEX Status: Triple Green ✅✅✅
* IVR: 58.9
* IVx Avg: 106.6
* Flow Bias: CALLS 26.5% — moderately bullish
The options oscillator is still trending upward, giving bulls the upper hand — but not an aggressive breakout just yet.
📊 Price Action & Trade Setup (1H + SMC Analysis):
TSLA just fired an explosive bullish move from the 220s, reclaiming 240 and running up toward 250 into resistance. However, the SMC dashboard suggests “No Trade Suggested” yet. Why?
* The price is now entering a premium zone, where R/R becomes unfavorable
* We have no CHoCH/BOS trigger from this zone yet
* EMA9 and EMA21 have not confirmed a full retest yet
* Strength Meter is bullish but not at full momentum
What to Watch:
* If price can hold above 249–250 and break through 252 with volume → 260+ is possible
* If price stalls or rejects around 252, a pullback to 240–241 could be a high-RR dip entry
* EMA9 and EMA21 are critical — volume reactions there will set up the next clean move
* If volume fades below 240 → be cautious of a rollover into 225–230 demand zone
📌 Summary / Thoughts:
TSLA bulls are reclaiming territory fast — but the move is reactionary and volume-driven. For now, I’m waiting for a confirmation BOS/CHoCH in this premium area before committing. Risk is elevated at these levels. I’d prefer a pullback into the 240 zone with EMA confirmation for a cleaner long setup. If we break and hold above 252, targets toward 260–265 open up fast.


TSLA LongTSLA Long
Current demand Zone (218) confirmed,
Sell put below next two demand
Long entry 225
no Stop
Target 300
Risk management is much more important than a good entry point.
I am not a PRO trader.
In my trading plan, the Max Risk of each short term trade should be less than 1% of an account.

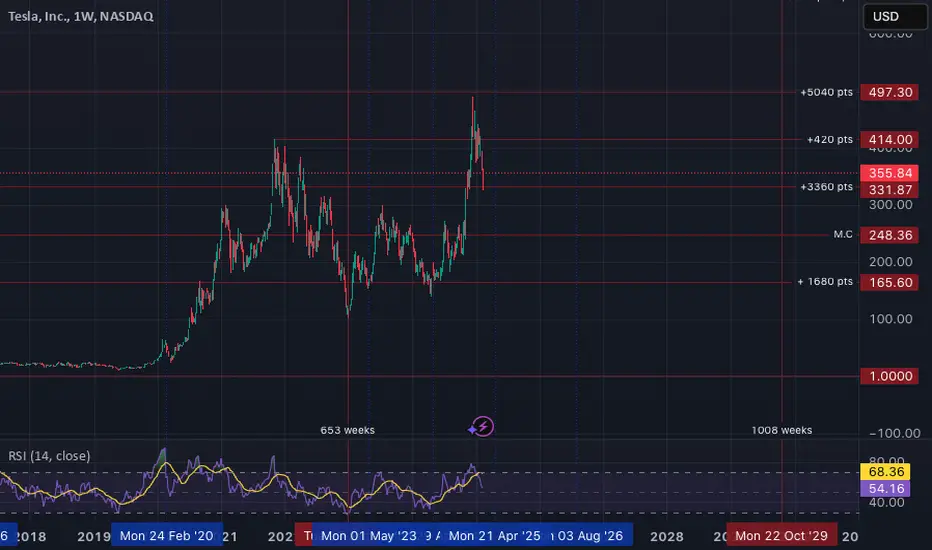
TSLA Elliott wave Analysis 20/4/2025For me, I think that TSLA have already End the Cycle (count from the first day TSLA is IPO).As you can see there is a clear divergence at the wave 5 of the A wave,suggesting that A wave of the corrective wave should be end and ready for the huge B wave that might take a lot of time (Since it is the B wave of the massive wave 2).But there is a change that the wave A that is coming down might be the part of WXY pattern or others pattern so we have to keep an eye on.

TSLA Weekly Options Trade Plan 2025-04-17TSLA Weekly Analysis Summary (2025-04-17)
Below is an integrated analysis of the reports and market data:
──────────────────────────────
MODEL REPORTS – KEY POINTS
• Grok/xAI – Price and moving averages on both 5‑min and daily charts are below key EMAs; RSI and MACD point to current bearish momentum. – Notable technical support at about 239.75 with resistance above near 242. – The options chain shows heavy put activity at the $240 strike (premium about 0.67), and max pain is at 245, although that level is less relevant for a near‐term (0DTE) trade. – Recommendation: Trade the TSLA $240 PUT at an ask of 0.67 at the open, aiming for roughly a 100% gain and using about a 50% loss as a stop.
• Gemini/Google – Technicals on short‐term and daily timeframes are mixed: the daily chart is clearly bearish while some 5‑min indicators hint at stabilization. – Conflicting signals (including the max pain pull toward 245 and falling VIX) result in not having a high‑conviction directional bias. – Conclusion: “No trade” is recommended today because the conflicting indicators raise the risk of getting whipsawed.
• Claude/Anthropic – Technical analysis on both 5‑min and daily confirms a moderately bearish bias (price well below major EMAs, RSI below 50). – However, one suggested trade was a TSLA $237.50 PUT at an extremely low premium (0.13) which seems less attractive given the preferred premium range. – In essence, the model sees downside potential but selected a strike a bit further out from the current price.
• Llama/Meta – A moderately bearish setup is noted, with the technical picture similar to the others on very short‐term charts. – However, the model also flags the influence of max pain at 245 and concludes that a naked call (for example, at the $240 or $242.50 strike) could profit if the upward “max pain pull” works in play. – Ultimately, this view contrasts with the put trades favored by others.
• DeepSeek – Confirms the overall technical picture: price is below key averages, with bearish momentum evident on both 5‑min and daily charts. – Emphasizes the high open interest on $240 puts and the near-term support at 239.75. – Recommends buying the TSLA $240 PUT at its 0.67 ask price for this weekly (0DTE) option. ────────────────────────────── 2. AREAS OF AGREEMENT AND DISAGREEMENT
Agreements: – Most reports note that TSLA is trading in a moderately bearish state with price below the relevant moving averages and key support levels near 239.75. – There is broad recognition that options activity is concentrated around the $240 strike—especially on the put side, where volume and open interest are very high, underscoring bearish positioning. – Technical indicators (RSI, MACD, Bollinger Bands) on short‑term and daily charts lean toward bearishness despite some very short‑term signals of stabilization.
Disagreements: – Gemini/Google sees too many conflicting signals (including the upward pull implied by max pain) and hence recommends no trade, while the majority of the other analysts view the setup as tradeable. – Llama/Meta is open to trading a naked call (capitalizing on the max pain influence) whereas Grok/xAI, DeepSeek, and to a lesser degree Claude/Anthropic advocate for a bearish put trade instead. ────────────────────────────── 3. CONCLUSION & TRADE RECOMMENDATION
Overall Market Direction Consensus: Most opinions point to a moderately bearish bias for TSLA on a near-term, 0DTE weekly horizon. Even though conflicting signals (like max pain toward 245 and some stabilization on very short timeframes) introduce uncertainty, the weight of the technicals and put side open interest lean toward downside pressure.
Recommended Trade: Trade a single‑leg, naked PUT (weekly option) on TSLA.
Trade Parameters: – Instrument: TSLA – Strategy: Buy a TSLA $240 PUT – Expiration: 2025‑04‑17 (weekly, 0DTE) – Premium: Approximately $0.67 per contract (slightly above the preferred range, but justified by high liquidity and clear technical support) – Entry Timing: At the open – Profit Target: Around 100% gain from the entry premium (i.e. exit near a $1.34 premium) – Stop‑Loss: Roughly a 50% loss at about $0.33 per contract – Confidence Level: Approximately 65% – Key Risks & Considerations: • The mixed signals (especially Gemini’s caution and the max pain theory) mean price could quickly reverse if TSLA rebounds near 245. • Very short‑term trading (0DTE) carries risks related to rapid time decay and volatility spikes. • A failure to break important support (around 239.75) would warrant an early exit. ────────────────────────────── 4. TRADE_DETAILS (JSON Format)
{ "instrument": "TSLA", "direction": "put", "strike": 240.0, "expiry": "2025-04-17", "confidence": 0.65, "profit_target": 1.34, "stop_loss": 0.33, "size": 1, "entry_price": 0.67, "entry_timing": "open" }
Disclaimer: This newsletter is not trading or investment advice but for general informational purposes only. This newsletter represents my personal opinions based on proprietary research which I am sharing publicly as my personal blog. Futures, stocks, and options trading of any kind involves a lot of risk. No guarantee of any profit whatsoever is made. In fact, you may lose everything you have. So be very careful. I guarantee no profit whatsoever, You assume the entire cost and risk of any trading or investing activities you choose to undertake. You are solely responsible for making your own investment decisions. Owners/authors of this newsletter, its representatives, its principals, its moderators, and its members, are NOT registered as securities broker-dealers or investment advisors either with the U.S. Securities and Exchange Commission, CFTC, or with any other securities/regulatory authority. Consult with a registered investment advisor, broker-dealer, and/or financial advisor. By reading and using this newsletter or any of my publications, you are agreeing to these terms. Any screenshots used here are courtesy of TradingView. I am just an end user with no affiliations with them. Information and quotes shared in this blog can be 100% wrong. Markets are risky and can go to 0 at any time. Furthermore, you will not share or copy any content in this blog as it is the authors' IP. By reading this blog, you accept these terms of conditions and acknowledge I am sharing this blog as my personal trading journal, nothing more.


TSLA 4H Analysis: Technical Outlook1. Price Structure and Trend:
TSLA has been in a clear downtrend since January 2025, dropping from ~$475 to a key support at ~$258. The price is currently consolidating at this level, hinting at a potential pause or reversal.
2. Support and Resistance Levels:
• Support: $258 (current level, with multiple bounces).
• Resistance: $300 (next significant zone, based on prior consolidation).
3. Volatility and Squeeze Indicators:
The "Volatility Squeeze" indicator (on the right) shows red and blue bars. Recent red bars signal a squeeze (low volatility), often preceding sharp moves. The shift to blue bars suggests volatility may be increasing.
4. Action Signals:
• "X" markers (blue and orange) highlight potential entry/exit points. Recent orange "X" marks at the $258 support could indicate a buying opportunity if the price confirms a bounce.
• If support breaks, the next level to watch is ~$225 (previous lows).
5. Conclusion:
TSLA is at a critical juncture. A bounce from $258 could target $300, but a breakdown might lead to $225. Keep an eye on volume and volatility for confirmation. What's your take?
Here is the link to the indicator

TSLA at a Crossroad: Can 252 Hold or Will It Crack?🔍 Technical Analysis (1H Chart Overview)
TSLA has formed a symmetrical triangle, compressing between an uptrend and a downtrend line. Price is hovering right near the apex, with a key horizontal level at $249.89, where it's showing indecision.
* Support levels:
* $239.67 → Previous demand zone
* $217.11 → Major swing low and last defense for bulls
* Resistance levels:
* $257.85 → Overhead rejection zone
* $276.91 → Major gamma wall and swing high
Volume is thinning out as price coils tighter, suggesting a breakout is imminent.
The RSI is neutral around 50, slowly curving upward, signaling slight bullish momentum building, but no confirmation yet. Price is consolidating on declining volume, which is often a pre-breakout setup.
🔧 Trading Bias:
Watch for breakout above $253 for potential long play toward $258–$265.
Breakdown below $249 flips bias bearish, with a retest of $239 then $230 likely.
⚙️ GEX Option Flow Insights
GEX data shows concentrated gamma resistance at $275–$280, with the highest positive NETGEX sitting right at $275 — that's our Gamma Wall. Above that, market makers become forced buyers, creating a squeeze scenario.
On the downside, there’s a strong PUT wall around $220 and $200, with -50.27% NETGEX at $200 acting as deep support.
Notably:
* IVR: 67.2
* IVx Avg: 108.9
* Call Flow: 15.2%
* GEX Sentiment: ☘️☘️🟢 (Bullish tilt, but not maxed out)
💡 Options Strategy Suggestion:
Consider a debit call spread if price breaks $253 with volume, targeting $265–$275.
If price breaks $249, put debit spreads to $230–$220 could offer solid reward.
🧠 Final Thoughts
TSLA is a coiled spring, and both TA and GEX show we’re at a key decision point. Let price tell you the story — react to breakout or breakdown. Gamma positioning offers high reward potential in both directions.
📌 Stay nimble, plan both scenarios, and use options to your advantage.

