US30: Dow Jones Rebounds as Buyers Emerge Near 40,700Dow Jones Rebounds as Buyers Emerge Near 40,700
The Dow Jones (US30) entered a bearish trend at the end of January, with its downward movement largely influenced by the Trump administration's reforms and unconventional approaches to the trade war.
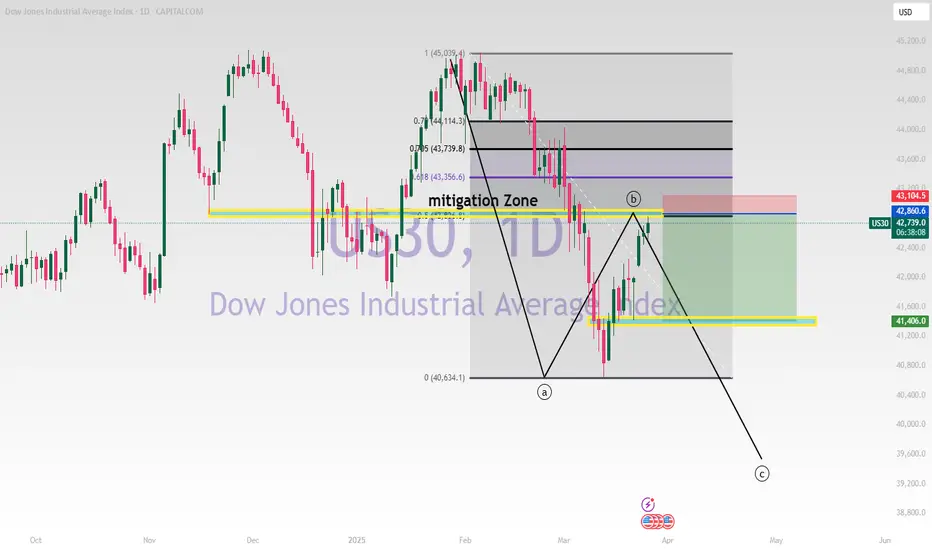
Over a span of approximately 2.5 months, the index declined by nearly 9.7%. However, it now appears that buyers are stepping back in near the 40,700 level, providing momentum for a potential bullish correction—or perhaps even a return to the previous uptrend.
Looking ahead, US30 is expected to recover, with key levels to watch at 42,320 and 42,935.
You may find more details in the chart!
Thank you and Good Luck!
❤️PS: Please support with a like or comment if you find this analysis useful for your trading day❤️
US30 trade ideas

Showing signs of a potential bearish reversal.📍 Entry: Around 42,746.9
📍 Stop Loss: Above 42,780.1 (To limit risk in case of a bullish continuation)
📍 Take Profit: 42,567.6 (Targeting the next key support area)
🔹 The price formed a strong rejection candle, indicating selling pressure.
🔹 Increased volume at the top suggests potential distribution.
🔹 A clean break below the recent support zone could accelerate the downtrend.

US30 (SHORT)
Price at Fib zone(50%) and mitigation zone confluence area with privots aswell for a down trend reversal.
Trade Idea: US30 Long ( BUY LIMIT )1. Technical Analysis Breakdown:
Daily Chart:
• Trend: Bullish overall, but showing signs of pullback.
• MACD: Bearish, indicating weakening momentum.
• RSI: At 45.23 — neutral but leaning toward oversold territory.
• Support level: Around 41,500.
• Resistance level: Recent high near 42,890.
15-Min Chart:
• Trend: Strong intraday upward momentum.
• MACD: Bullish crossover with momentum building.
• RSI: 69.09 — nearing overbought but still has room.
• Support: Around 41,760.
• Resistance: 42,208 (current price), next major level at 42,500.
3-Min Chart:
• Trend: Short-term bullish with a slight consolidation.
• MACD: Flat, showing a pause but no reversal yet.
• RSI: 53.19 — mid-range, suggesting more upside potential.
⸻
2. Fundamental Analysis:
• US economy shows resilience (strong job data, improved GDP).
• Fed’s stance on rates remains balanced, leaning dovish, supporting equities.
• Geopolitical tensions slightly cooling, risk appetite growing.
⸻
3. Trade Plan — Long Position (Buy)
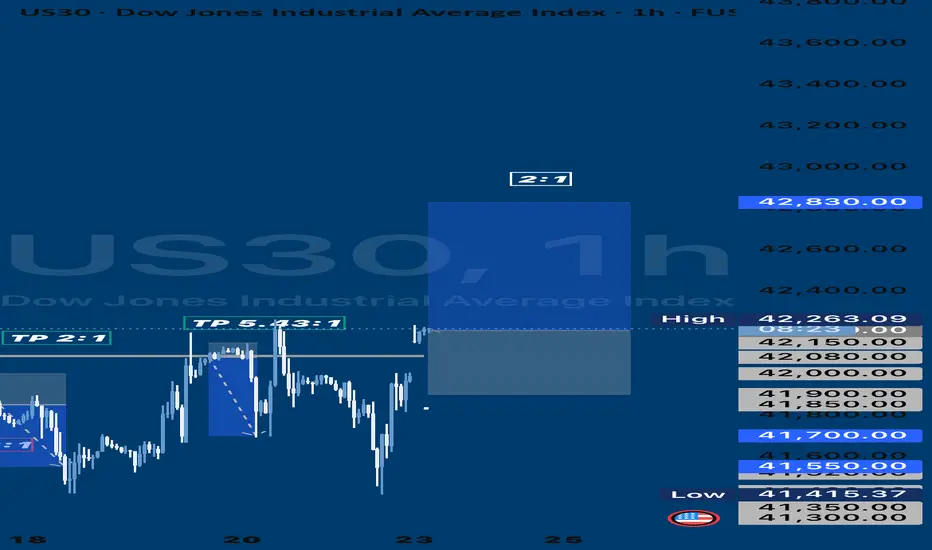
• Entry: 42,210 (after a clean break above consolidation).
• Stop Loss (SL): 41,900 (below recent intraday support).
• Take Profit (TP): 42,830 (previous daily high). FUSIONMARKETS:US30
Hanzo | US30 15 min Breaks – Confirm the Next Move(🆚) US30 – The Way of the Silent Blade
🔥 Bullish Break Out Path – 42680
🩸Liquidity Sweep – Institutions grab liquidity before pushing higher.
🩸CHoCH – Trend shift confirmation.
🩸Key Level Retest – Strong breakout zone.
🩸Weekly/Monthly Zone – Institutional accumulation.
👌 Entry: Break 42680 + volume → Retest → Long position → Secure profits.
🔥 Bearish Break Out Path – 42480
🩸Liquidity Sweep – Stop-clearing before reversal.
🩸CHoCH – Bearish trend confirmation.
🩸Key Level Retest – Historical reaction zone.
🩸Weekly/Monthly Zone – High-probability sell area.
👌 Entry: Break 42480 + momentum → Retest → Short position → Target lower liquidity.
☄️ Trading Insights:
💯 Liquidity moves the market.
✈️ Volume confirms breakouts.
👍 Precision wins—no hesitation.

DOW JONES Last chance to buy before it breaks the 1D MA50.Dow Jones (DJIA) has been trading within a 1.5 year Channel Up pattern since the July 2023 High. The market found itself under heavy pressure recently as the Channel unfolded its Bearish Leg which found Support right below the 1D MA200 (orange trend-line).
As the 1D RSI got oversold (<30.00) and rebounded, this is perhaps the last opportunity to buy low, before it breaks above its 1D MA50 (blue trend-line) on what is technically the new Bullish Leg.
The previous Bullish Leg (November 2023 - March 2024) hit the 2.0 Fibonacci extension on a +23.94% rise, before it broke below its 1D MA50 again. As a result, it is possible for Dow not to break again below its 1D MA50 once broken, before it reaches the 2.0 Fib which sits at 50000. Our Target is a little lower than that at 49000.
-------------------------------------------------------------------------------
** Please LIKE 👍, FOLLOW ✅, SHARE 🙌 and COMMENT ✍ if you enjoy this idea! Also share your ideas and charts in the comments section below! This is best way to keep it relevant, support us, keep the content here free and allow the idea to reach as many people as possible. **
-------------------------------------------------------------------------------
Disclosure: I am part of Trade Nation's Influencer program and receive a monthly fee for using their TradingView charts in my analysis.
💸💸💸💸💸💸
👇 👇 👇 👇 👇 👇

US30: Sell below $42,360FX:US30 is currently retesting previously broken is currently retesting previously broken support on daily tf.
With price showing bearish divergence, break of support ($42,360) could start a bearish rally on smaller timeframes!

More bulls for US30!!Price is climbing relentlessly after finding support at 40. Waiting for a break above 42.8.and look for good entries

djiDow Jones - DJI
- Completed " 1234 " Impulsive Waves
- Break of Structure
- RSI - Divergence
- Order Block
- Resistance Level

Dow Jones at trendline support: Will it bounce to 44,812$?CAPITALCOM:US30 is undergoing a corrective pullback after forming a double top near the upper boundary of the ascending channel. The rejection from this resistance zone triggered increased selling pressure, driving the price back toward the lower boundary of the channel, where buyers are now looking to step in.
If buyers step in and defend this support, we could see a move toward the midline of the channel, with the next key target at 44,812. Holding above this level would reinforce the bullish trend structure and increase the probability of continuation toward the upper boundary of the channel.
However, a failure to hold trendline support could weaken the bullish outlook, leading to a potential breakdown and further downside pressure. Price action near this critical zone will be key in determining the next directional move.
Traders should monitor candlestick formations and volume for confirmation. As always, managing risk effectively is essential when trading this setup.
If you have any thoughts on this setup or additional insights, drop them in the comments!

Us30 sell market technicals Us30 sell market technicals. Looking like a nice drop from trend lines. Signal was sent to GTE vip.

US30 Bullish Higher Time FrameUS30 is showing a bullish pattern of AB=CD pattern as shown on the chart.

US30 SELL OPPORTUNITY Price just got resisted around the area of $42,637 a sell opportunity is envisaged from the current market price. In higher timeframe, the daily , and the H4, sellers are dominating the market. This is an intraday sell opportunity

Dow Jones INTRADAY awaits US Consumer Confidence dataThe Consumer Confidence Index, set to be released today at 14:00 GMT by the Conference Board, measures consumer sentiment on spending, jobs, inflation, and the economy. Since consumer spending drives the U.S. economy, a strong reading can signal bullish momentum for equities, while a weak reading may indicate bearish sentiment. Traders watch this data closely for insights into market direction.
Key Support and Resistance Levels
Resistance Level 1: 42847
Resistance Level 2: 43162
Resistance Level 3: 43442
Support Level 1: 41828
Support Level 2: 41400
Support Level 3: 40687
This communication is for informational purposes only and should not be viewed as any form of recommendation as to a particular course of action or as investment advice. It is not intended as an offer or solicitation for the purchase or sale of any financial instrument or as an official confirmation of any transaction. Opinions, estimates and assumptions expressed herein are made as of the date of this communication and are subject to change without notice. This communication has been prepared based upon information, including market prices, data and other information, believed to be reliable; however, Trade Nation does not warrant its completeness or accuracy. All market prices and market data contained in or attached to this communication are indicative and subject to change without notice.

DOW JONES - FAKE BREAKDOWNHello Traders !
The US30 failed to break the support level (41603 - 41958).
The price formed a bullish candlestick pattern.
So, I expect a bullish move🚀
_______________
TARGET: 42965🎯

Hanzo | US30 15 min Breaks – Confirm the Next Move🆚 US30 – The Way of the Silent Blade
⭐️ We do not predict—we calculate.
We do not react—we execute.
Patience is our shield. Precision is our sword.
🩸 market is a battlefield where hesitation means death. The untrained fall into traps, chasing shadows, believing in illusions. But we are not the crowd. We follow no signal but the one left behind by Smart Money. Their footprints are our way forward.
🩸 Bearish Structure Shatters
Key Break Confirms the Path – 42480 Zone
our reversal always at key level
even a reversal area is well studded
reasons
Liquidity Swwep
liquidity / choch
key level / multi retest before
weekly / monthly zone
🔻 This is the threshold where the tides shift. If price pierces this level with authority, it is no accident—it is designed. The liquidity pool above has been set, and the institutions will claim their prize. Volume must confirm the strike. A clean break, a strong push, and the path is set.
Watch the volume. Watch the momentum. Strike without doubt
