Dow Jones - Volatility is HighLevels mentioned here are based on the market volatility and it is purely for the study purpose only.
US30 trade ideas
US30 (DOW JONES) 4H – Bullish Breakout BUY Setup
US30 (Dow Jones Industrial Average) is pushing higher, breaking through previous resistance levels. Price is now trading at 44,586.48, confirming strong bullish momentum after reclaiming the 44,000 psychological zone.
We remain bullish — looking for continuation of this breakout.
---
BUY Trade Setup:
🔵 Buy Limit: 44,500.00 – 44,520.00
🛑 Stop Loss: 44,400.00
🎯 Take Profit 1: 44,750.00
🎯 Take Profit 2: 45,000.00
---
Why Buy?
✅ Clear bullish market structure.
✅ Price consolidating after breakout — healthy sign for continuation.
✅ Smart Money likely accumulating for next leg up.
We ride with momentum — no reason to fight the trend.
---
Summary:
Bias: BUY ONLY 🔥
Setup: Wait for price to retest 44,500 – 44,520 zone, look for rejection, then enter.
Risk Management: Respect SL — trade with discipline.
---
💬 Are you buying US30 too? Let me know your setup below!
#US30 #DowJones #Indices #TradingView #BuySetup #SmartMoney #FrankFx14

Dow’s fighting hard for that breakoutDow Jones is moving within a bullish channel
with low selling pressure —
strong legs pushing toward the top.
I’m expecting another solid bullish leg.
BLACKBULL:US30

US30 buy(low probability because of low volatility)Weekly candle formation: OHLC/OLHC
Structure>liquidity>orderblock!
Bullish structure
Internal liquidity
Orerblock pojnt of interest.

US30 Technical Outlook – 07/03/2025📍 US30 Technical Outlook – 07/03/2025
Another day of consolidation at the highs 💼⏳
Price is holding firmly above both EMAs (20 & 50), showing sustained bullish structure—but struggling to break cleanly above 44,700–44,760 🧱
🧠 Key Observations:
Tight consolidation between 44,500 → 44,700
Strong bounce off EMA zones (44,500 area acting as dynamic support)
Still no confirmed breakout of the 44,760 top range
📊 Key Price Zones:
🔼 Resistance: 44,708 → 44,762 → 45,000
🔽 Support: 44,500 → 44,250 → 44,000
📈 Trade Setup Ideas:
🔹 Long Setup (Base case):
Buy pullbacks to 44,500 or EMA zone (20 & 50 EMA support)
Look for a breakout and retest of 44,760 for confirmation
Target: 45,000 psychological zone
🔻 Short Setup (Only on breakout failure):
Look for rejection wicks or bearish engulfing at 44,760
Scalp back toward 44,500 or lower
Only valid if volume drops off or price starts forming LHs/LLs on lower TFs

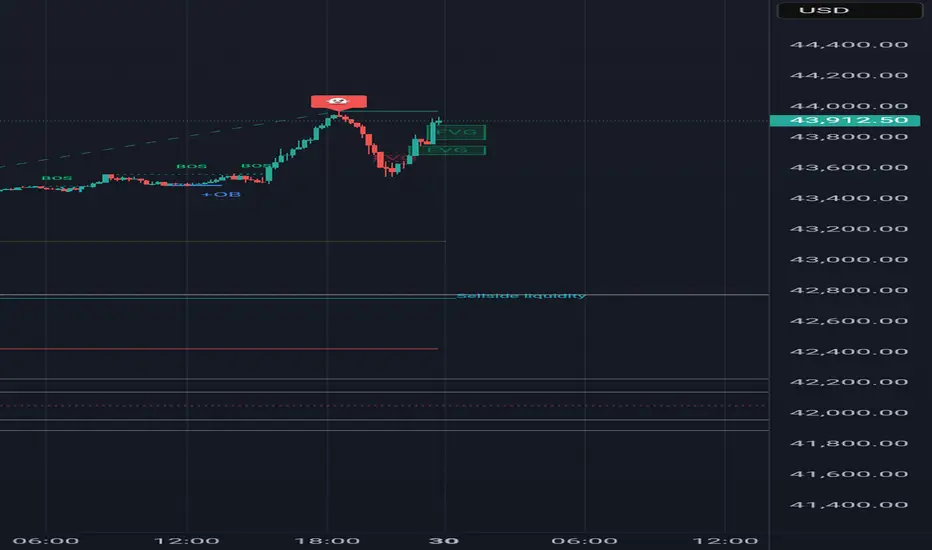
US30 Scalp short Swing failure patternSwing failure pattern with bearish FVG, wait for bearish candle confirmation, liquidity below

Possibility of uptrend It is expected that after some fluctuation and correction, the resistance area will be broken and the upward trend will continue. If the index crosses the green support area, a downward trend to the specified support levels will be possible.

US30 Technical Outlook – 07/02/2025📍 US30 Technical Outlook – 07/02/2025
The bull train keeps rolling! 🚂 Price smashed through the 44,250 resistance level and is now testing the next major zone at 44,700 → 44,760 🔥
🧠 Key Observations:
Price has extended way above the EMAs ✅
EMAs (44,266 and 44,496) still pointing sharply upward ✅
Market consolidating right under 44,760 resistance 📍
📊 Key Price Zones:
🔼 Resistance: 44,700 → 44,760 → 45,000
🔽 Support: 44,500 → 44,250 → 44,000
📈 Trade Setup Ideas:
🔹 Long Bias (Still favored trend-side):
Wait for pullbacks toward 44,500 → 44,250
Buy dips with bullish confirmation patterns (engulfing, pin bars, EMA support hold) ✅
Target: 44,760 → 45,000
🔻 Short Bias (Countertrend – Only on rejection!):
Watch for rejection wicks or bearish reversal setups from 44,700–44,760
Could target quick flush down to 44,500 → 44,250 support
⚠️ Important: Price has been parabolic, so chasing here is dangerous. Wait for clear setups, either dip buys or high-timeframe rejection.

US30 Sell analysis/ideaThis analysis is based on multiple timeframes and executed using reversal trading and trend formation. complete explanation in the video!

Dow Jones Wave Analysis – 1 July 2025
- Dow Jones broke the resistance zone
- Likely to rise to resistance level 45000.00
Dow Jones index recently broke the resistance zone located at the intersection of the resistance level 44000.00 (former top of wave iv from March) and the resistance trendline of the daily up channel from May.
The breakout of this resistance zone accelerated the active impulse wave (3) – which is part of the multi-month upward ABC correction 2 from April.
Dow Jones index can be expected to rise to the next resistance level 45000.00 (target price for the completion of the active impulse wave (C)).

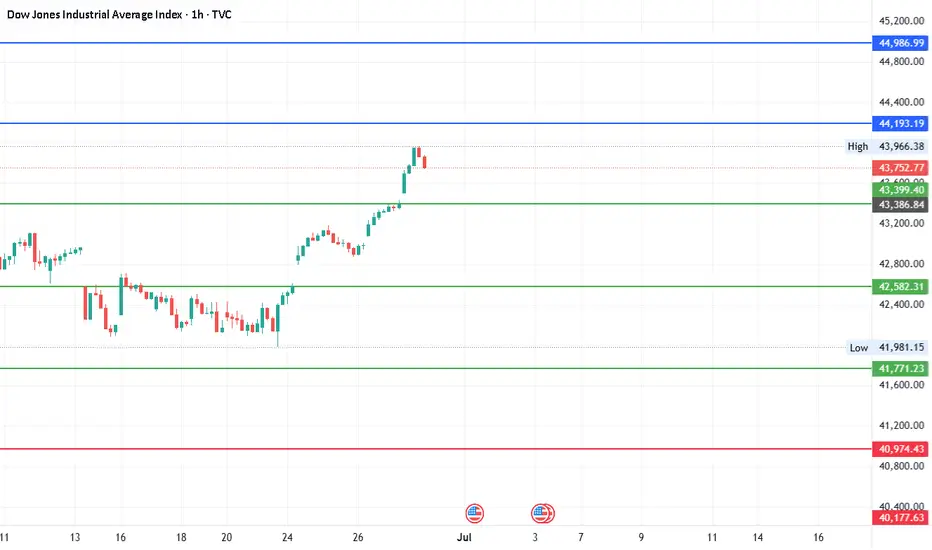
#DJI - Pivot is 42582.31 | Target 38374.12 or 46790.50?Date: 27-06-2025
This is in continuation with the previous post of 8000 points target. We have a new pivot point for the next move.
#Dow Jones Current Price: 43880.
Pivot Point: 42582.31 Support: 41771.23 Resistance: 43399.40
#Dow Jones Upside Targets:
Target 1: 44193.19
Target 2: 44986.99
Target 3: 45888.75
Target 4: 46790.50
#Dow Jones Downside Targets:
Target 1: 40974.43
Target 2: 40177.63
Target 3: 39275.875
Target 4: 38374.12
US30: Bears Are Winning! Short!
My dear friends,
Today we will analyse US30 together☺️
The market is at an inflection zone and price has now reached an area around 44,041.6 where previous reversals or breakouts have occurred.And a price reaction that we are seeing on multiple timeframes here could signal the next move down so we can enter on confirmation, and target the next key level of 44,013.0..Stop-loss is recommended beyond the inflection zone.
❤️Sending you lots of Love and Hugs❤️

US30 Technical Outlook – 07/01/2025📍 US30 Technical Outlook – 07/01/2025
Monster rally continues! 🚀 Price exploded off the 42,100–42,200 demand zone and has now pushed deep into the 44,150–44,250 major resistance area.
🧠 Key Observations:
Trend remains extremely bullish ✅
Price is consolidating just under 44,250 resistance 📍
EMAs (43,894 and 44,052) still showing strong upward momentum ✅
📊 Key Price Zones:
🔼 Major Resistance: 44,150 → 44,250 → 44,400
🔽 Key Support: 43,800 → 43,600 → 43,400
📈 Trade Setup Ideas:
🔹 Long Bias:
Pullbacks into 43,800 → 43,600 support
Look for bullish continuation setups if price stays above EMAs
Target: Breakout toward 44,250 → 44,400
🔻 Short Bias (Countertrend / Caution):
Only look for short scalps if price gives clear rejection (wicks, bearish engulfing, etc) from 44,250–44,400 zone
Possible downside target: 43,800–43,600

US30 Buy SetupI have two zones for US30 Buy but I think price should trigger my limit to take out the BSL(Buy Side LIq) before going down

Look into it{
"alerts": [
{
"name": "US30 Bull Break",
"condition": {
"symbol": "US30",
"operator": "crossing",
"value": 43950
},
"message": "📈 US30 Breakout Alert: Price crossed above 43,950. Watch for BUY setup targeting 44,100.",
"actions":
},
{
"name": "US30 Bear Rejection",
"condition": {
"symbol": "US30",
"operator": "crossing_down",
"value": 43800
},
"message": "📉 US30 Bearish Rejection: Price fell below 43,800. Watch for SELL setup toward 43,400 OB.",
"actions":
}
]
}
US30 Is on the move up as sellers get low buyers are winning the move pushing the price all the way up as there is a lot of pressure for the price to go all thr way higher to create a w shape as seen in the chart watch out for more buys than sells on this pair goodday

US30Persistent inflation and expectations about Federal Reserve interest rate policy continue to influence investor sentiment.
Sector Performance: The rally has been broad-based, with increased activity in industrials and technology components.

US30 looking for the short on Bearish PAI believe we can expect a pull back down to JuBias: Short-term Bearish (Contingent Setup)
Context: Price is currently trading just below a high-probability supply zone between 44,048 – 44,277. This area aligns with prior highs and liquidity, making it a prime zone to look for a short-term rejection if strong bearish price action (PA) appears on the 4H or Daily timeframes.
We are currently seeing strong bullish momentum on the Weekly, Daily, and H4 candles. Any short positions from this zone must be reactive — not anticipatory. A clear bearish signal (e.g., engulfing, structure break, supply confirmation) is required to consider entry.
Key Zone:
Seek bearish PA between 44,048 – 44,277
Contingency: If price breaks and closes above 44,250 (2024 highs), expect continuation toward 45,000
Short Targets if Rejection Occurs:
Target 1: 43,350
Target 2: 42,500
Extended Target: 41,734 (June Low)
Post-Rejection Bullish Scenario:
If we do get a rejection and targets are met, we will then look for bullish PA in the demand zones (42,500 or 41,700) to consider long setups back toward the 2024 highs and potentially beyond.
Breakout Scenario:
If price breaks and closes above the 44,277 zone early this week, we anticipate the next leg to 45,000 before any meaningful reversal.
At this stage, it’s a waiting game — let price action lead. We don’t predict, we react.ne lows before an

Weekly Forex Outlook Sun.June.29.2025 - Fri.July.4.2025Like and Comments would be appreciated :D Not Financial Advice, Just my outlook/opinion

US30 DETAIL ANALYSIS
1. Fundamental Analysis
The US30, tracking 30 of the largest publicly traded companies in the U.S., currently reflects a mixed but cautiously optimistic macroeconomic backdrop.
Economic Growth Outlook
The U.S. economy contracted by 0.5% annualized in Q1 2025, revised down from initial estimates. The contraction was largely driven by a surge in imports before new tariffs took effect, which distorted net exports. As a result, the Federal Reserve revised its 2025 GDP growth forecast to approximately 1.4%—a downgrade from the previous 1.7% projection. Private-sector forecasts, including those from Deloitte and S&P Global, echo this view, suggesting a growth range between 1.1% and 1.5% for the year.
Inflation & Federal Reserve Policy
Core PCE inflation—the Fed’s preferred metric—rose to 2.7% year-over-year in May, above the central bank's 2% target. Similarly, core CPI held at 2.8%. While inflation is cooling compared to previous cycles, it remains sticky. Consequently, the Fed has signaled no immediate plans to cut rates, with the earliest possibility being in September. Inflation expectations for year-end 2025 have been revised up to around 3%, in part due to geopolitical shocks and new tariffs.
Labor Market & Consumption Trends
The unemployment rate remains stable near 4.2%, reflecting labor market resilience. However, real disposable income and consumer spending both declined in May, down 0.3% and 0.7%, respectively. The drop indicates potential weakening in consumer demand and future GDP prints. Confidence indices also showed a dip, although a decline in inflation expectations could moderate the downside pressure.
Tariff Effects and Global Risk
Average U.S. tariff levels are at historic highs, ranging between 15–19%, weighing on import costs and corporate margins. The ongoing trade frictions with China, coupled with Middle East tensions (particularly between Israel and Iran), add geopolitical volatility and inflationary risks. Leading institutions warn of stagflation—a toxic mix of slow growth and persistent inflation—pressuring equity valuations.
2. Commitment of Traders (COT) Report Evaluation
The latest COT data reflects a nuanced view of institutional behavior in equity index futures:
Asset Managers have increased net long exposure to US indices, including the Dow, suggesting underlying bullish conviction from long-term holders.
Leveraged Funds (Hedge Funds) have shown mixed sentiment—reducing short positions, but not aggressively adding longs—indicating a cautious optimism.
Retail Traders are predominantly short , which often signals further upside potential due to their tendency to be positioned against the dominant trend.
This asymmetric positioning—combined with macro and structural tailwinds—strengthens the smart money bias toward continuation of the bullish trend, especially as the Dow approaches key technical levels.
3. Technical & SMC-Based Analysis
The daily US30 chart reflects a clear bullish structure, rooted in classic Smart Money Concepts:
Market Structure
A Valid Break of Structure (BOS) confirms upside intent, following a successful sweep of internal liquidity.
The sequence of Higher Highs (HH) and Higher Lows (HL) remains intact.
Internal Liquidity has been swept, with price now targeting external liquidity near the All-Time High (ATH) zone.
Key Technical Levels
Buying Area 1: Around 43,150 – labeled as the H4 inducement zone. A retest here with bullish price action (engulfing or FVG fill) may trigger continuation long entries.
Buying Area 2: Between 42,450–42,650 – a deeper demand zone where price previously showed strong displacement. A high-probability re-entry zone upon confirmation.
Short-Term Sell Area: Around 44,800 – this zone aligns with potential distribution. Short positions should only be considered here upon confirmation of bearish BOS.
ATH & BSL: The final liquidity target in the current structure, marking the range highs.
Liquidity Pools
Sell-Side Liquidity (SSL): Around 41,800, and a Strong Low exists near 40,900 – both are key areas to be respected in the bullish thesis.
Price is currently aiming toward external BSL above ATH, which is likely to be swept before any significant correction.
4. Strategic Outlook & Trade Plan
✅ Bullish Continuation Scenario
Buy Entry #1: 43,150 zone – confirmation through bullish PA on retest.
Buy Entry #2: 42,450–42,650 – deeper re-entry upon mitigation of FVG or OB.
Take Profit Targets:
TP1: 44,800 (potential distribution zone),
TP2: 45,200 (external BSL at ATH).
Stop Loss: Below 42,200 (under Demand Area 2 or SSL).
⚠️ Bearish Contingency (Only if BOS to Downside)
Monitor for failed structure or strong rejection at 44,800–45,200.
BOS below 43,000 could shift structure and signal a move toward the 42,200 zone.
Break of Strong Low (~40,900) invalidates bullish structure.
Conclusion
The current market environment supports a measured bullish bias in the US30, driven by:
Resilient labor and inflation expectations moderating;
Institutional accumulation per COT data;
A technically clean smart money bullish structure;
Potential for liquidity sweep above ATH before any significant distribution.
That said, macro risks such as tariffs, global geopolitical tensions, and sticky inflation remain key wildcards that could introduce volatility.
NOTE: ONLY FOR EDUCATIONAL PURPOSE NOT A FINANCIAL ADVICE

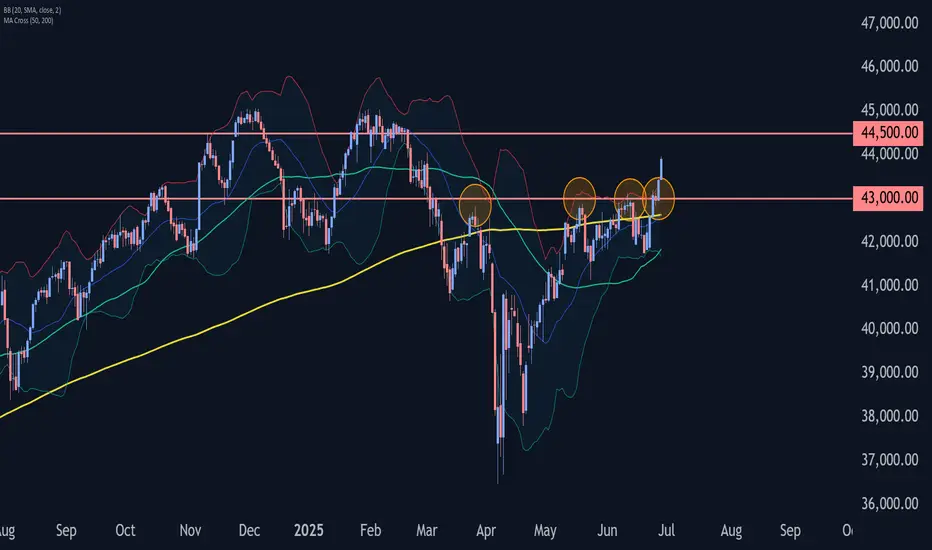
Dow Jones Wave Analysis – 27 June 2025
- Dow Jones broke pivotal resistance level 43000.00
- Likely to rise to resistance level 44500.00
Dow Jones index recently broke above the pivotal resistance level 43000.00 (which has been reversing the price from the end of March, as can be seen from the daily Dow Jones chart below).
The breakout of the resistance level 43000.00 accelerated the active impulse wave 3 of the intermediate impulse wave (C) from the end of May.
Dow Jones index can be expected to rise to the next resistance level 44500.00, which is the target price for the completion of the active impulse wave (C).
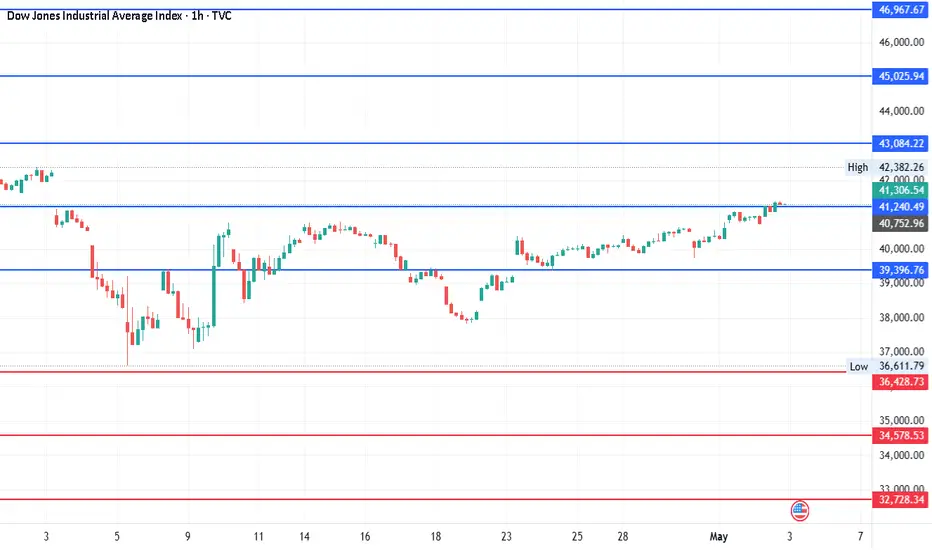
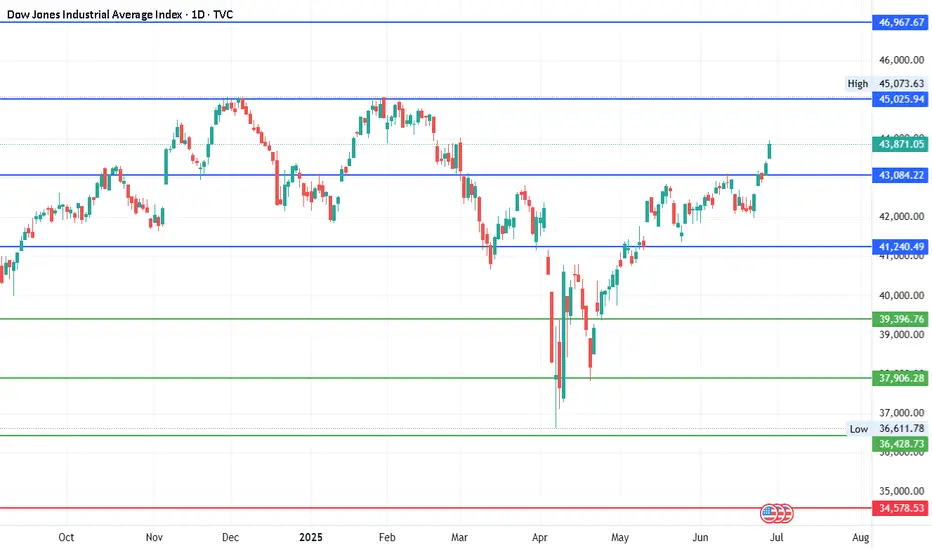
#DJI - 5000 Pts already moved out of 8000 points..Date: 27-06-2025
#DJI - 5000 Pts already moved out of 8000 points as posted on 22nd April. Another 3000 points to cover. we have different pivot for the next level up and it will be shared soon.
Old levels are as follows.
#DJI Upside Targets: 41240.49, 43084.22, 45025.94 and 46967.67
#DJI Downside Targets: 34578.53, 32728.34, 30786.61 and 28844.88
Current price is around 43,870 at the time of this post.
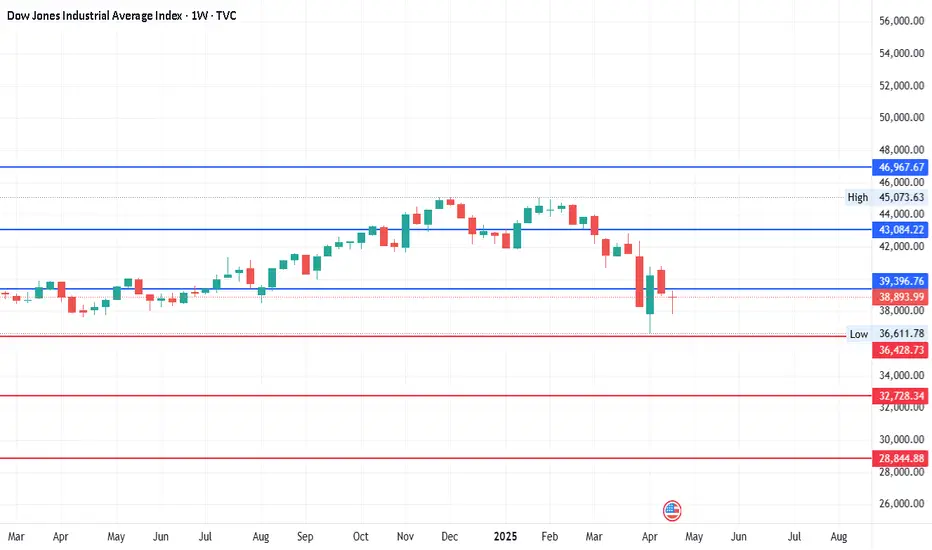
DJI - 2000 pts already moved out of 8000 pts since last posted?It has already moved around 2000 points since last posted on 22nd April. Expecting around 8000 points moved as per mentioned earlier and the levels are still the same. Introduced additional levels for the better understanding. So, another 6000 points move pending before any reasonable correction? let's see.
Upside: 41240.49, 43084.22, 45025.94 and 46967.67
Downside: 34578.53, 32728.34, 30786.61 and 28844.88