V LongDemand Zone under Support zone
Entry 212
Stop 204
Target 235
Risk management is much more important than a good entry point.
I am not a PRO trader.
In my trading plan, the Max Risk of each short term trade should be less than 1% of an account.
V trade ideas

Buy $V - NRPicks 19 NovVisa Inc. operates as a payments technology company worldwide. It facilitates digital payments between consumers, merchants, financial institutions, businesses and strategic partners. It operates VisaNet, a payment transaction processing network.
Revenue TTM 24.1B
Net Income TTM 12.3B
EBITDA TTM 16.6B
EBITDA margin TTM 68.9%.
Debt/EBITDA TTM 1.26x

Visa drop expected short termTarget zone i son the chart and might will have a bounce from that zone. The big question is how strong the bounce will be?
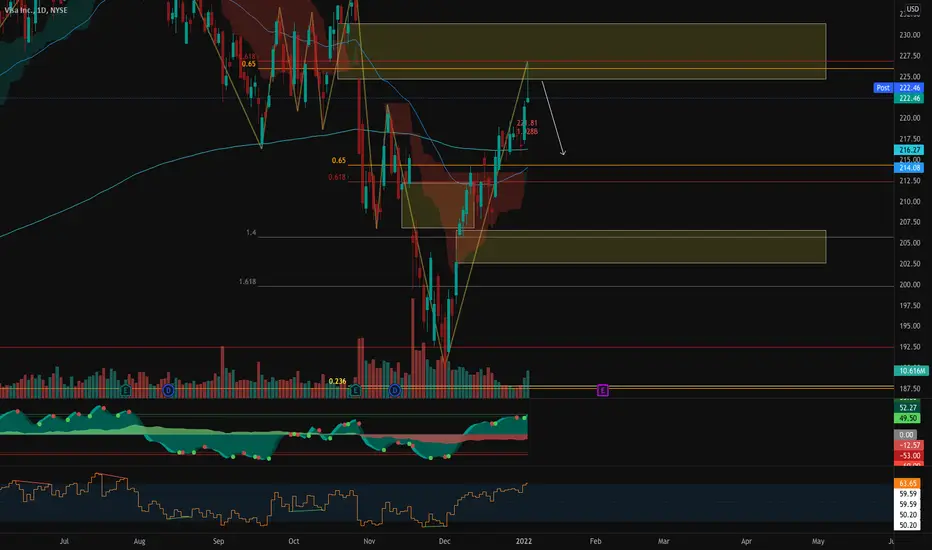
Visa Thanks to an inverted H&S and a higher 10yr Visa rallied up to 225 resistance before pulling back. I dont think visa will break above 225 with higher yield movement or company news.
At 225 you have 3 resistances
1. 200sma
2.downtrend
3. fibonacci resistance
Look for a pull here possibly to 210.
Stop loss 227

VISA Reversal Head and Shoulder with Bull EMA cross (short-term)Bullish Reversal head and shoulders on the 4 hour and 1 day chart in unison with fast ema's crossing slow ema's. Hoping for quick jump to 230+ in short term. Be careful if planning on holding for long term.

Visa Head&ShouldersThis is straightforward, the head & shoulders pattern gives a good probability of strong bullish action. Visa is a safe investment from a technical and fundamental perspectives.

V Head and shoulders but the sexy kindV has a tasty looking inverse head and shoulders forming. Bears are trying to flex their muscles but if V holds 213 area it should be a nice pop up to 226

v buybuy after the break above the resistance level and 200ma at 222.73 .. first target next resistance level 234.22 .. finally target 247.00

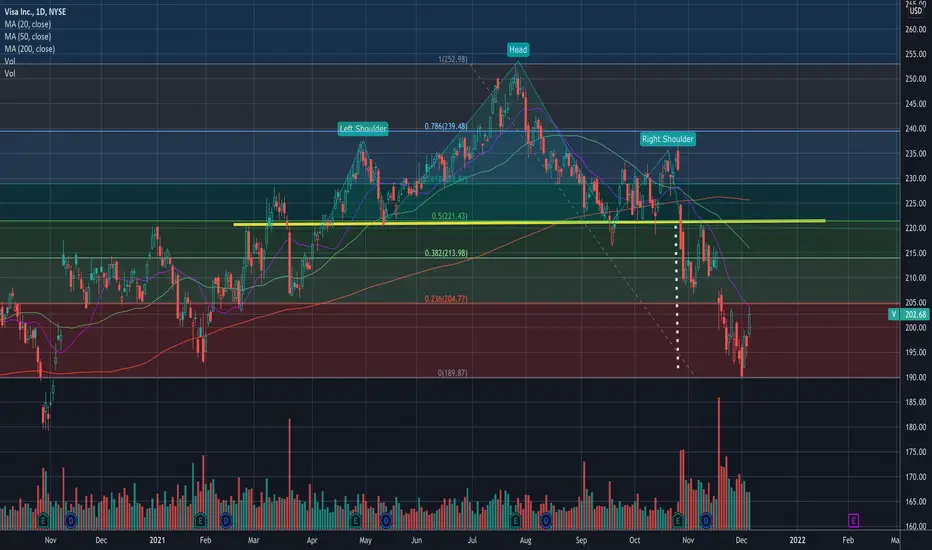
Short on VisaDespite all the good news about Visa, my opinion is that it will go down.
We can notice that a head and shoulder has been formed. This is a reversal pattern that have been taking form for almost 7 month. We can also see the volume that accompanied the neck break. (In a few words, this is a confirmation that there is a reversal in the market trend.
We can also visualize another head and shoulder that was formed in a downtrend, (Just after the break of the first one) but unlike the one mentioned above, this one is not being accompanied by a high volume.
In my opinion, as long as there is not a significant purchases on Visa´s Shares, “it is better go short”

Visa updateThe bouncing ball bounced ! No suprise there. Recently validate neutral RSI, now making an inverse head and shoulder for a potential wave 3.
Everything is on the chart, follow levels first :)


VISA_Break DownThe roof of the descending canal is broken.
It has penetrated into the cloud of Como but failed to break it.
It has not been able to stabilize above the Como cloud and the descending channel.
It looks like it will improve in the next month.

Visa (Inverse head and Shoulder )V break of 219.06
Inverse head and shoulder
Price target 1. 226.93
Price target 2 236.96
Options 21 jan 22
220 calls or 225

Reverse head and shoulders .. Not sure if anyone else caught this but if feel free to comment on the idea

$V - Falling wedge watching for puts < 209$V - Falling wedge watching for puts < 209
- Daily outside bar formed, rejected at supply zone, 0.5 retracement level

VISA SHORTIt appears VISA has one more drop left for 5th wave to complete an expanding ending diagonal, after which It will be setting up f or a bull run. This is just for education purpose only, not an investment advise.

VISA SHORT It appears VISA has one more drop left for 5th wave to complete an expanding ending diagonal, after which It will be setting up f or a bull run. This is just for education purpose only, not an investment advise.

Bear Market Bounce in Visa?Visa has had a rough quarter as fundamentals weaken in the increasingly crowded payments space. Now it’s rebounded toward areas where sellers may return.
The first pattern on today’s chart is the declining 50-day simple moving average (SMA). The credit card giant hasn’t quiet reclaimed this line but it’s getting close. It could be potential resistance.
Next is the price zone between roughly $216 and $220, which encompasses several potential levels. For example, the peaks of September, November and December of 2020, and the lows of May and September 2021. One or more of those could offer resistance.
Third, stochastics show an overbought condition following the recent bounce.
TradeStation is a pioneer in the trading industry, providing access to stocks, options, futures and cryptocurrencies. See our Overview for more.
Important Information
TradingView is not affiliated with TradeStation Securities Inc. or its affiliates. TradeStation Securities, Inc., TradeStation Crypto, Inc., and TradeStation Technologies, Inc. are each wholly owned subsidiaries of TradeStation Group, Inc., all operating, and providing products and services, under the TradeStation brand and trademark. When applying for, or purchasing, accounts, subscriptions, products and services, it is important that you know which company you will be dealing with. Please click here for further important information explaining what this means.
This content is for informational and educational purposes only. This is not a recommendation regarding any investment or investment strategy. Any opinions expressed herein are those of the author and do not represent the views or opinions of TradeStation or any of its affiliates.
Investing involves risks. Past performance, whether actual or indicated by historical tests of strategies, is no guarantee of future performance or success. There is a possibility that you may sustain a loss equal to or greater than your entire investment regardless of which asset class you trade (equities, options, futures, or digital assets); therefore, you should not invest or risk money that you cannot afford to lose. Before trading any asset class, first read the relevant risk disclosure statements on the Important Documents page, found here: www.tradestation.com .

$ VISA 2 Hours DISCLAIMER:
I am not a financial or investment advisor. All information found here, including any ideas, opinions, views, predictions, forecasts, commentaries, suggestions, or stock picks, expressed, or implied herein, are for entertainment purposes only and should not be construed as personal investment advice. If you decide to invest, please make your own decision, or contact the specialists’ institutions. Thank you

$V - Head and shoulder break down target reached! V bottom? Visa has paid in full for head and shoulder break down and stock has now reversed.
$204 to $205 can act as resistance area. Breaking above that area would be bullish. Looking like this could be a case of V bottom.
Target 1 - $212
Target 2 - $221
Target 3 - $231
Risk - unable to break above $205
———————————————————
How to read my charts?
- Matching color trend lines shows the pattern. Sometimes a chart can have multiple patterns. Each pattern will have matching color trend lines.
- The yellow horizontal lines shows support and resistance areas.
- Fib lines also shows support and resistance areas.
- The dotted white lines shows price projection for breakout or breakdown target.
Disclaimer: Do your own DD. Not an investment advice.
Long VAfter a measured move down which brought us to sub 200, visa looks to have broken the falling wedge. I am bullish on visa and i think these prices are an absolute deal right now.
So far it seems to be holding the trend and i do expect it to make its way back to 250 especially with holidays coming up. Expecting it to retest the line before moving up.
I am long visa so i will be adding shares here for long term.
For a swing trade idea:
Pt 1:215
Pt 2: 225.
DYOR.

VISA SEEMS READY TO CHANGE DIRECTIONPlease find my $V analysis.
I believe we will soon reverse to the long side. Today's was a strong day, but still we might go lower as per the chart.

$V Short below 192Looketh like dogewater, gulag to 175.
Tradingview makes me type more words to post this ....
